Getting started
Reading your first results
A tour of Overview: the headline, the five headline numbers, the trend, the brand ranking and one answer in full.
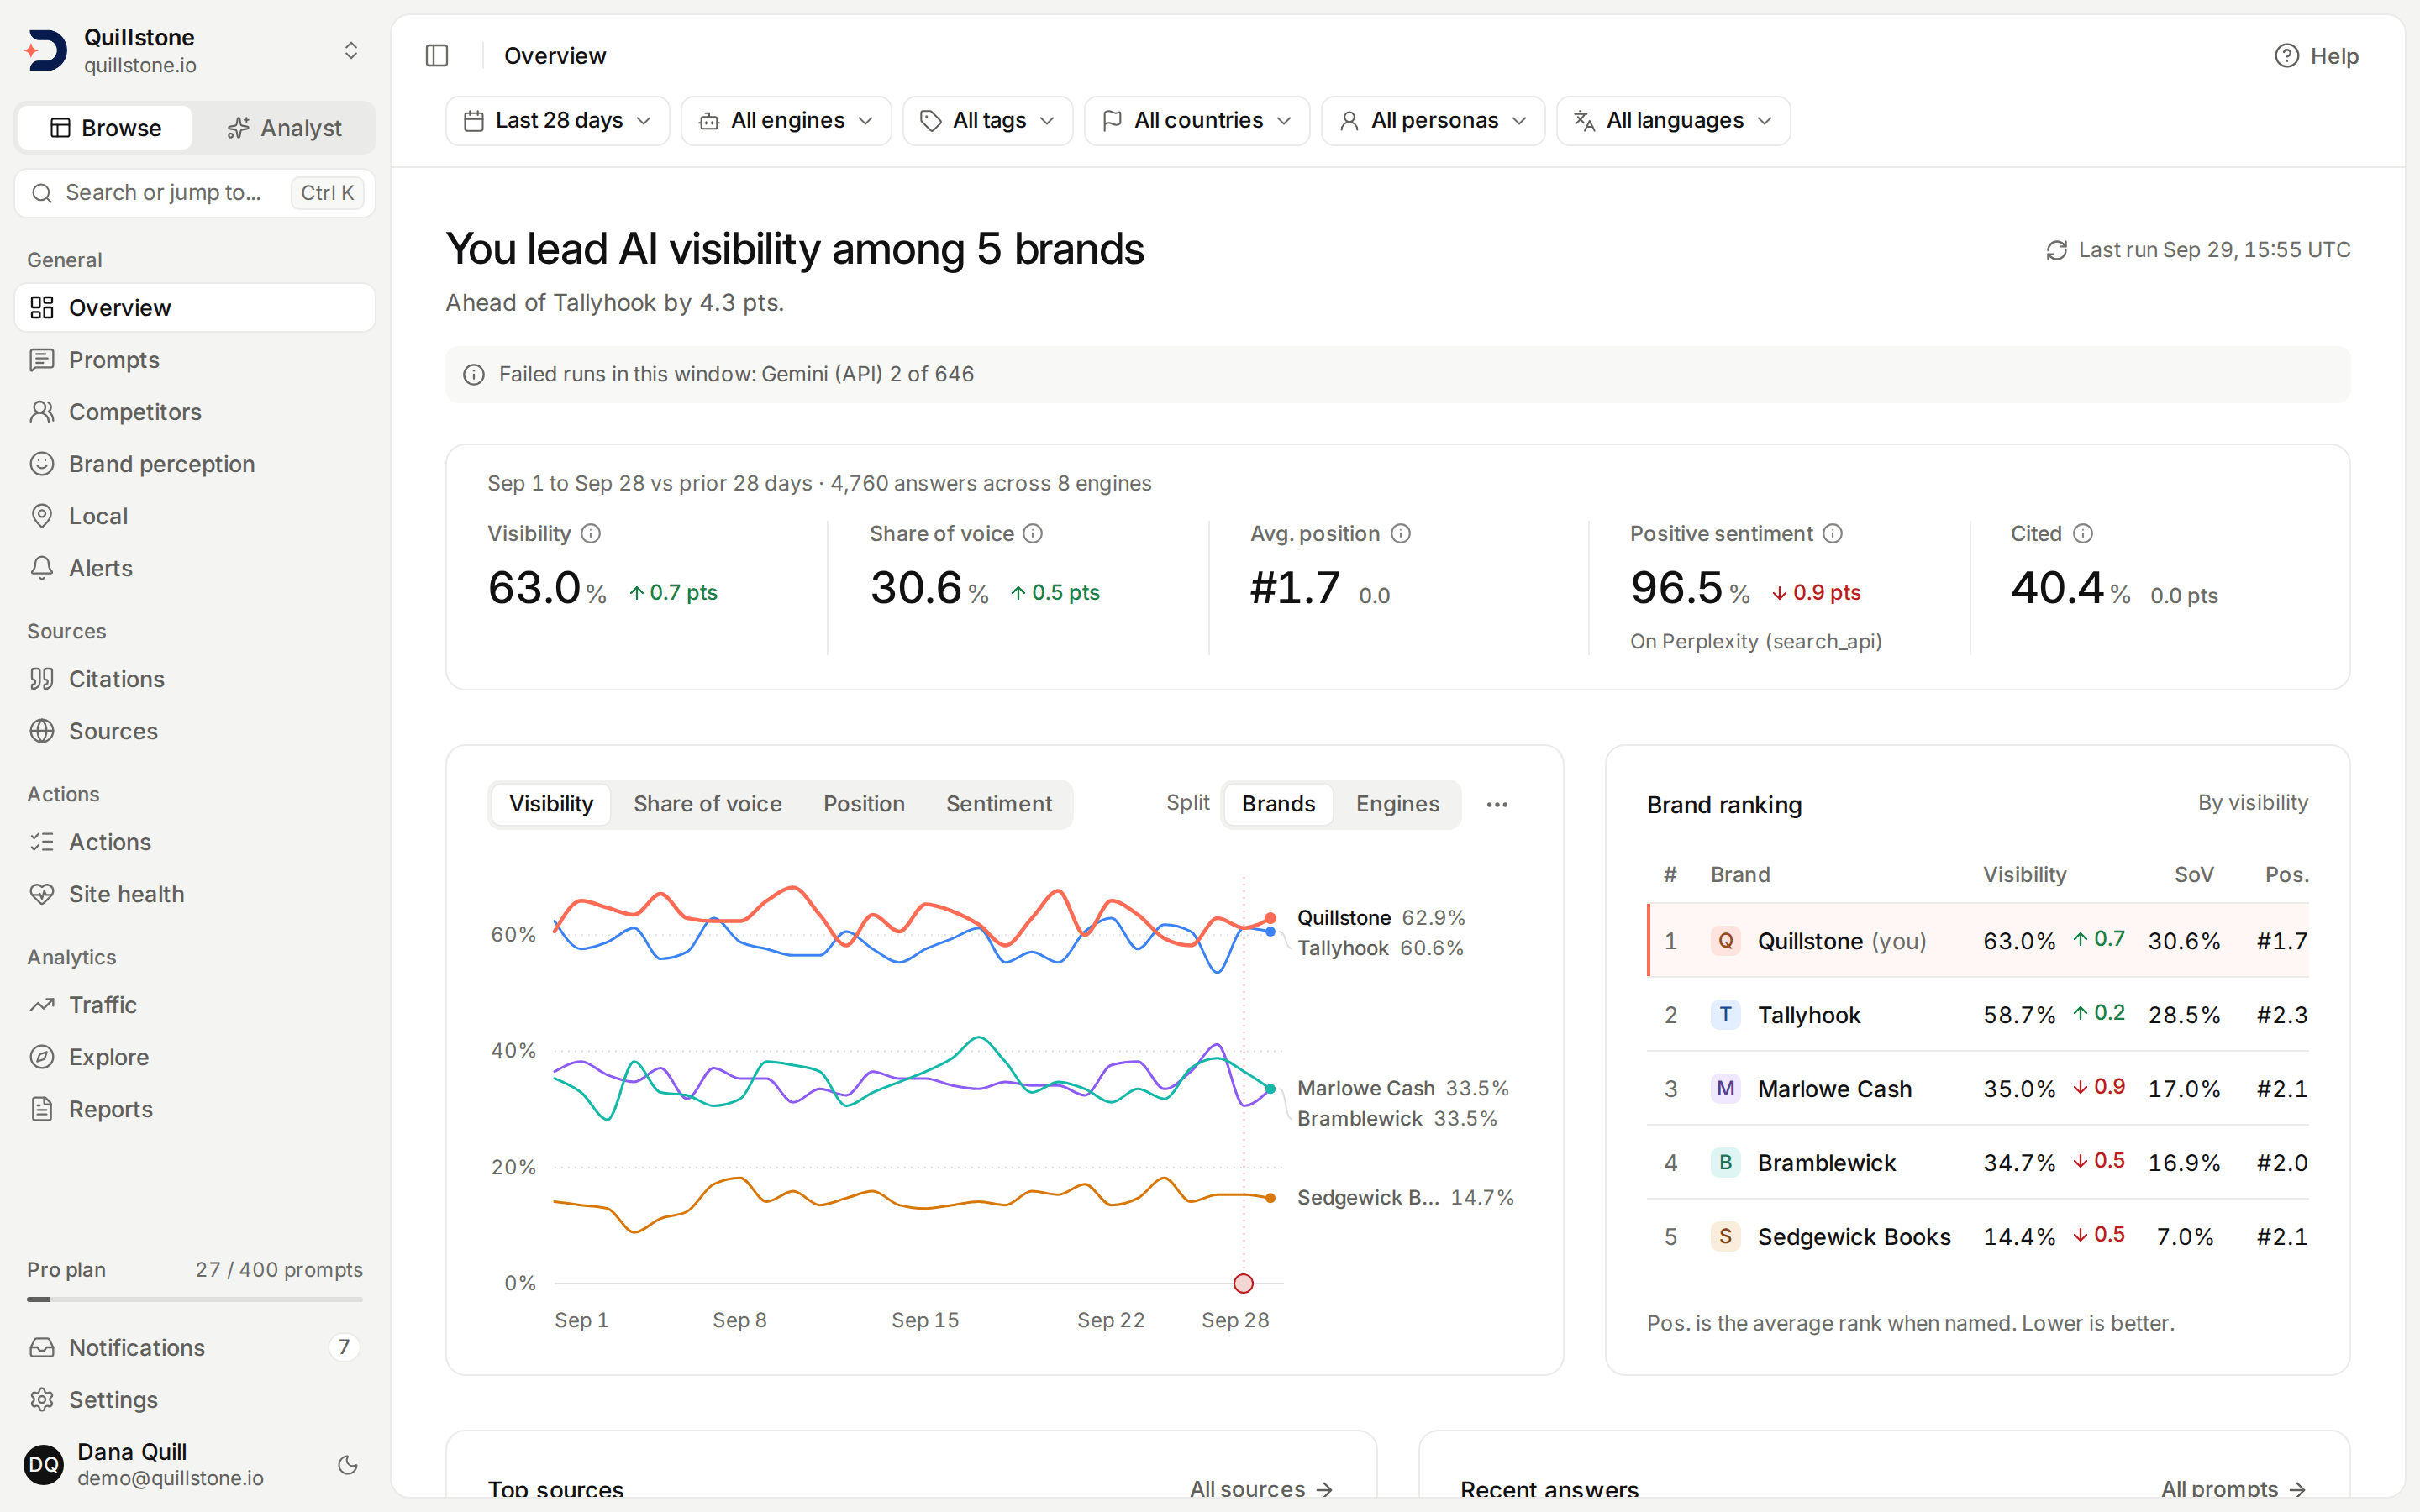
The ChatGPT (app) and Gemini (app) answers counted in this screenshot are demo data: fixed fictional responses run through the product's own collection code.
Overview at a glance
Overview is what you land on after signing in: how your brand stands against the competitors you track in AI answers, for the date range and filters set in the filter bar at the top of the page (28 days unless you choose 7 or 90). Everything else in the product hangs off the sidebar in four groups: General (Overview, prompts, competitors, brand perception, local results and alerts), Sources (citations and the sites behind them), Actions (To do, optimizations, page issues, articles and site health; Actions opens on To do) and Analytics (traffic, the Explorer and reports). A screen with several views shows them as tabs under its title. Which project you are looking at is set by the project switcher at the top of the sidebar, and it stays that way as you move between screens. To jump straight to a screen, choose Search or jump to in the sidebar or press Ctrl K (Cmd K on a Mac).
Every metric on Overview, from the headline to the top sources, is an
Explorer result, built from the Explorer's own
definitions over the Explorer's windows, so Overview and the Explorer agree
for the same dates
(api/services/overview.py#build_summary,
api/services/explorer/metrics.py#compute_raw). A 7, 28 or 90 day window
ends yesterday, and each change is measured against the same number of days
immediately before it, so an answer collected today counts from tomorrow
(api/services/explorer/query.py#resolve_window, #compare_window).
Loading Overview spends the project's Explorer query budget, as described in
The query budget and time limit
(api/services/explorer/query.py#execute_queries).
The screen reads top to bottom: a headline sentence, the five headline numbers, a trend chart beside a brand ranking, then the sources AI engines cite most and the latest answers.
The filter bar
The filter bar sits at the top of every screen except the Explorer, the
Analyst, settings and notifications. It holds six chips, one value each
(frontend/src/lib/filters.js#FILTER_KEYS):
- Date range: the last 7, 28 or 90 days, ending yesterday; 28 unless
you choose otherwise. An answer collected today counts from tomorrow
(
frontend/src/lib/filters.js#readDays,api/services/explorer/query.py#resolve_window). - Engine: one AI engine, such as ChatGPT (app) or Perplexity, with every way
its answers were collected pooled, so Perplexity's search and Sonar
channels count as one engine
(
api/services/answer_filters.py#resolve_answer_filters). The chip offers the engines that answered this project's prompts in the last year. - Tag: one of the project's tags, or No tag for prompts that carry none of them. A prompt with two tags still counts once.
- Country: one of the countries your prompts are tracked in.
- Persona: General, for answers collected with no persona, or one persona. Archived personas are listed last, marked "Archived", because their answers are still part of your history.
- Language: As written, for prompts run untranslated, or one language your prompts run in.
Tag, country, persona and language pick answers by the prompt target they
were collected for (api/services/answer_filters.py#conditions). A chip
with fewer than two choices in the project is disabled and says so, for
example "No tag choices in this project yet", because its one value would
select every answer
(api/services/answer_filters.py#available_filter_options,
frontend/src/lib/components/shell/FilterBar.svelte#tipFor).
A chip is enabled only on a screen where every number honours it
(frontend/src/lib/nav.js#filtersFor). Elsewhere it is disabled, with the
tooltip "Not available on this screen yet"; a disabled date chip still shows
a 7, 28 or 90 day choice you made, because it applies again on the next
screen that takes it. Where the page filters that dimension with its own
control, the disabled chip says so instead, for example "Persona (page
filter)" on Suggestions, with the tooltip "This page has its own persona
filter"; Fact check shows "Date range (page filter)" and "Engine (page
filter)", because it has its own 7, 30 or 90 day window and its own
engine filter on the review queue
(frontend/src/lib/nav.js#HUBS, frontend/src/lib/filters.js#disabledChipLabel,
frontend/src/lib/components/shell/FilterBar.svelte#tipFor):
| Screen | Chips that apply |
|---|---|
| Overview, Local, Sentiment, Reasons, Compare, Citations, Domains, Mentions, Types, Comparison, Social, Retrieved vs cited, Earned (Discover view) | All six |
| Competitors and a competitor's own page | Date range and engine |
| A prompt's own page | Date range, engine, country, persona and language |
| Tracked prompts | Tag, country, persona and language, which choose the prompts listed |
| AI traffic | Date range and engine |
| Alerts, Search, Site traffic, an earned source's own page | Date range |
The other Prompts tabs, Objections, Fact check, Citation gaps, the Actions and Site health screens, Dashboards and Reports take none of them.
Your selection follows you from screen to screen, including through the
sidebar, the tabs and Search or jump to
(frontend/src/lib/filters.js#carryFilters). Switching project keeps only
the date range, because tags, countries, personas and languages belong to
a project (frontend/src/lib/filters.js#projectSwitchHref). Reset
clears all six (frontend/src/lib/filters.js#withoutFilters). A value in
a link that is not this project's, such as a tag from another project or
a deleted persona, reads as "All" and is never applied
(frontend/src/lib/filters.js#activeFilters).
The headline
The page title is a sentence about where you rank on brand visibility
among you and your tracked competitors: "You lead AI visibility among 4
brands", "You're #2 of 4 in AI visibility", or "You're tied for #2 of 4 in
AI visibility". The line under it names the gap in points: who you are
ahead of when you lead, or who leads and by how much when you trail. When
you trail and both windows are measured, it adds whether you closed some of
that gap or it grew over the window. With no tracked competitor measured,
the title reads "You're named in X% of AI answers"; with no analysed answer
in the window, it reads "No analysed answers in the last 28 days yet", with
the window's own length in place of 28, or "No analysed answers match the
filters in the last 28 days" while a chip other than the date range is set
(frontend/src/lib/overview.js#headline). When the brand at the top shows
0.0%, every tracked brand shows 0.0%, so the title reads "Every tracked
brand is at 0.0% visibility in the last 28 days" instead of a rank. Values
are rounded to one decimal, so 0.0% can still hide a brand named in a very
small share of answers. When your
visibility rests on fewer than 30 analysed answers, the line under the title
reads "Low sample: n = 12 analysed answers." in place of the gap sentence
(frontend/src/lib/overview.js#headline).
Rank and the count of brands include only brands with a measured
visibility. Gaps and ties use the one-decimal values on screen, so two
brands that both show 22.8% are tied, and the arithmetic in the sentence
can be checked against the ranking beside the chart
(frontend/src/lib/overview.js#rankRows).
Beside the headline, "Last run" gives the time of the latest completed
answer in the project, or of a later run where Google showed no AI answer,
in UTC, whatever the window; "Collecting N answers
now" appears while runs are still pending or running
(api/services/overview.py#_collection_status). Before the first
answer completes, the title reads "Your first answers are on the way" and
each section below says what it is waiting for
(frontend/src/routes/(app)/+page.svelte#waiting).
Two notices can appear under the headline, one line each. "Brand figures
use N of M answers; the rest are still being analysed" means some collected
answers have not had their brand mentions extracted yet, so the brand
numbers rest on fewer answers than the cited rate. "Failed runs in this
window" lists every engine with at least one failed run in the window, as
its failed runs out of its completed runs, failed runs and, on a Google
engine, runs where Google showed no AI answer, which are not failures
("Perplexity 6 of 315")
(frontend/src/routes/(app)/+page.svelte#notices,
api/services/overview.py#_failed_runs). "Last run", the failed-runs
notice and the chart's event markers describe the whole project, so the
filter bar's engine, tag, country, persona and language do not narrow
them (api/services/overview.py#_collection_status, #events).
The five headline numbers
The strip's header gives the window's dates, the length of the earlier
period it is compared with, and how many answers were collected across how
many engines. An engine counts once however many channels it answers
through, so Perplexity's search and Sonar channels are one engine. Each cell
has an info icon carrying its formula
(frontend/src/lib/components/overview/KpiStrip.svelte#cells,
frontend/src/lib/overview.js#engineCount).
| Cell | What it measures |
|---|---|
| Visibility | Share of analysed answers that name your brand family (brand visibility) |
| Share of voice | Your brand's mentions over the mentions of every tracked brand (share of voice) |
| Avg. position | Your average rank in the answers that name you; lower is better (brand position) |
| Positive sentiment | Share of your classified mentions that are positive, on one engine channel, named under the number |
| Cited | Share of collected answers where one of your pages is a source (citation rate) |
Positive sentiment is read on one engine channel because sentiment is
compared within one channel, never averaged across engines. Overview picks
the channel with the most analysed answers in the window, and the cell says
"On" that channel, named the way the trend's engine lines name it
("Perplexity (search_api)" when an engine has several channels)
(api/services/overview.py#build_summary,
frontend/src/lib/overview.js#seriesName).
Each change is against the earlier period, in points for the four rates.
An engine counts as measured in a period only when it ran (an answer, or a Google run that showed no AI answer) on at least
80% of that period's answered days, the days on which any engine has an
answer (6 of 7 when every day was answered)
(api/services/collection_health.py#WINDOW_PRESENCE_MIN_PERCENT). A first period with answers on only a few days is measured
against those days, so a new project gets its changes as soon as it has a
prior period. When some engine that answered in either period was not
measured in both (an engine added to your plan during the window, such as
the Google engines, ChatGPT (app) or Gemini (app) at launch, one switched off, or one
that ran on only a few of the days), the change compares only the engines
measured in both, while the number itself still covers every engine, and a
note under the strip's header says "Changes
compare only the engines measured in both periods." The brand ranking's
changes follow the same rule, so the headline's comparison with the leader
does too; the trend chart does not
(api/services/overview.py#_compare_shared_engines,
frontend/src/lib/overview.js#engineChangeNote).
For Avg. position a fall is an improvement, so a lower position shows as a
change for the better (frontend/src/lib/overview.js#deltaInfo). A number
with nothing behind it reads "–" with "Not measured" under it and no
change. A number built from fewer than 30 observations still shows, with
"Low sample (n = 12)" under it, the same small-sample floor as the rest of
the product.
The trend
The trend chart draws one metric across the window, one point a day unless you switch to weekly: Visibility, Share of voice, Position or Sentiment. Split chooses what each line is.
- Brands draws you and the first five competitors of the brand ranking.
With more competitors than that, a note under the chart says "Showing you
and the top 5 competitors by visibility"
(
frontend/src/lib/components/overview/TrendCard.svelte#SHOWN_COMPETITORS,api/services/overview.py#TREND_BRANDS). - Engines draws only you, one line per engine channel with answers in
the window; with an engine chosen in the filter bar, only that engine's
channels. A note lists the engines with no line: not on your plan, no
answers in this window, or, for Google AI Overviews and Google AI Mode,
no AI answer shown in this window (every run there showed none), and
only the chosen engine when there is one
(
api/services/overview.py#_not_measured). - Sentiment is available only with Brands, and on one engine channel at
a time, chosen from a list above the chart; it starts on the channel the
Positive sentiment cell uses. Under Engines the Sentiment button is
disabled, because sentiment is not comparable across engines, and it is
also disabled when no engine has an analysed answer in the window
(
api/services/overview.py#build_summary,frontend/src/lib/components/overview/TrendCard.svelte#sentimentOff).
The menu beside Split sets the granularity. Weekly needs the 90-day window, and a week the window covers only in part says "partial" when you hover it. The same menu offers Download CSV, the Explorer export of the query the chart ran, when the project's plan includes data exports, and Open in Explorer, which opens that query in the Explorer.
How to read the lines:
- A day with no measured value is a gap in the line, never a drop to 0%. Rate axes start at 0%; the Position axis is upside down, with #1 at the top.
- Each line ends in a label with its name and value, placed on its last
point with at least 30 observations, or its last measured point when none
has that many. A dot on a point with fewer than 30 observations (the dot
under a line's label, a point with no neighbour to join, or the point you
hover) is drawn hollow, and hovering such a point says "low sample
(n = N)". A line with no measured point still gets a label, with "–" for
its value (
frontend/src/lib/overview.js#labelIndex). - When a label sits on an earlier point than the chart's last day (because
the newer points have fewer than 30 observations), a note under the chart
says so: "Labels show the latest day with at least 30 answers: Aug 10"
when every label is on that one day ("week of Aug 10" by week), otherwise
"Labels show each line's latest point with at least 30 answers." The count
is in the metric's own unit: answers for Visibility and Position, mentions
for Share of voice and Sentiment. A label
that could only use a low-sample point is already the line's newest value,
so it does not bring up the note
(
frontend/src/lib/overview.js#labelNote). - Fewer than five days (or weeks) with any measured value, and the chart is
replaced by "Not enough history for a trend yet", or by "Not enough
answers match the filters for a trend" while a chip other than the date
range is set
(
frontend/src/lib/components/overview/TrendChart.svelte#MIN_PERIODS).
Markers along the bottom of the chart show what happened in the window:
articles published, optimizations applied and alerts detected, dismissed
alerts left out (api/services/overview.py#events). Alerts are
tinted. Markers closer than 14 pixels merge into one, and a marker's
tooltip lists up to three events and how many more there are. Choosing a
marker opens the first event it lists
(frontend/src/lib/overview.js#groupEvents, #mergeEventGroups).
The brand ranking
Beside the trend, Brand ranking lists you and every active tracked
competitor by visibility over the window, with each brand's change in
visibility, its share of voice and its average position. It is built from
brand mentions in AI answers, not from which domains are cited, so it
answers a different question from the domain-citation figures on
Competitors
(api/services/overview.py#_ranking).
Ranks follow the headline's rule: brands showing the same one-decimal
visibility share a rank, and a brand with no measured visibility has no
rank and shows "–". Unmeasured brands sit at the bottom. A competitor's row
opens its page on Competitors; your own row, marked "(you)", is not a link
(frontend/src/lib/components/overview/BrandRanking.svelte#rows).
Top sources and recent answers
Top sources lists the five domains cited by the most answers in the
window, each with the share of collected answers citing it ("In 18.4% of
answers"). A domain is marked "Your page" when it is your project's domain
and "Acme's site" when it belongs to an active tracked competitor. All
sources opens Domains
(api/services/overview.py#_sources). Whether a third-party page
names you is shown per page in the answer drawer below, not per domain here.
Recent answers shows the five newest of the 20 newest completed answers
the page loads. It is a feed rather than part of the window, so it includes
today's answers, but it does follow the filter bar's engine, tag, country,
persona and language. Each row shows the engine, the prompt, and "Mentioned #N"
(your position in that answer), "Not mentioned" or "Not analysed yet"; a
link icon means one of your pages is a source in that answer
(api/services/overview.py#recent_answers,
frontend/src/lib/components/overview/RecentAnswers.svelte#SHOWN).
All prompts opens the prompt list.
The answer drawer
Choosing a recent answer opens it in full in a panel on the right. The
header tags the engine and, when the answer was collected for one, the
country, persona and language; View prompt opens the prompt. Under the
prompt, one line gives when it was answered (in UTC) and how many brands
and sources it has, with the same Mentioned or Not mentioned tag and a
"Cited" tag when one of your pages is a source, read from the answer itself
once it has loaded
(api/services/overview_answer.py#build_answer,
frontend/src/lib/components/overview/AnswerDrawer.svelte#status).
The answer is shown as plain text, split into paragraphs, with each named
brand highlighted once, where its first mention was found. Markdown is
tidied away: headings, bold and italic marks, citation markers such as
"[1]" and "[2][6]", and a link's address, which leaves its text
(api/services/overview_answer.py#_markup_to_drop, #_clean). A brand whose
name cannot be found in the text, or that would overlap another highlight,
is left unhighlighted rather than marked in the wrong place. An answer
longer than 20,000 characters is shortened, and a note says so
(api/services/overview_answer.py#segment_answer,
#MAX_ANSWER_CHARS).
Beside the answer:
- Brands in answer: each brand in order, with its position and its sentiment in this answer ("Not classified" when there is none). Untracked brands are muted.
- Fan-out searches: the searches the engine ran while answering, when any were captured.
- Sources: up to 20 distinct pages, best rank first, each linking out.
Each page is marked Your page (on your domain), Mentions you (its
saved text names your brand, matching the names in your own brand family
literally), No mention (its saved text does not), or Not checked
(there is no saved copy of the page that could be checked, or your own
brand family is not set up yet, so there is nothing to look for)
(
api/services/overview_answer.py#_sources,#MAX_SOURCES,frontend/src/lib/components/overview/AnswerDrawer.svelte#STATUS).
Under the lists, a Next step block appears when one applies, chosen by
fixed rules, first match wins (frontend/src/lib/overview.js#nextStepMode):
- A cited page on a third-party site, neither yours nor an active
competitor's, that does not name you, when the answer was collected
inside the earned sources window of the
90 days ending yesterday. Owners and editors get Save as earned
source, which saves the page as an earned-source opportunity; viewers
get a link to Earned sources instead
(
api/services/overview_answer.py#EARNED_WINDOW_DAYS,frontend/src/routes/(app)/+page.server.js#actions). An answer from today is outside that window, so it never offers this step. - The answer has been analysed and does not name you: Open prompt.
Previous and Next, or the K and J keys, move through the answers the page loaded (the 20 newest); Esc closes the drawer.
Where the old Overview cards went
| If you want... | Go to |
|---|---|
| Citation rate by country, persona or language | The Explorer, broken down by that dimension |
| Citation rate engine by engine | The Explorer, broken down by engine |
| AI referral sessions and conversions | AI traffic |
| Recent alerts | The trend's markers, and Alerts |
| Prompts that gained or lost ground | The weekly report |
What no data means
A metric with nothing behind it yet reads as no data on every screen, never as a zero: those are different states with different causes. On Overview that is "–" and "Not measured" in a cell, and a gap in a trend line. Rather than repeat the rule here, see How to read any number here on Metrics defined for the full explanation of when a metric is ready to read as a real number.
Which number to read first
Start with visibility, the number the headline is built on. Of everything on Overview, it answers the most basic question: do AI engines name your brand at all, when someone asks the kind of thing your buyers ask. Share of voice, position, sentiment and the cited rate all matter, but each of them is a more specific question than that, and none of them means much until the basic one has an answer.
Where to go next
| If you want to see... | Go to |
|---|---|
| Which prompts you are tracking, and each one's own answers | Prompts |
| Where your domain has actually been cited | Citations |
| Prompts where a competitor is cited and you are not | Citations → Gaps |
| How you compare against the competitors you added | Competitors |
| Traffic AI engines are actually sending to your site | Traffic → AI traffic |
| Search Console and GA4 performance, if you connected them | Traffic → Search and Site traffic |
| Any metric broken down and filtered your own way | Explore → Explorer |
Related
- Metrics defined: every number's exact formula and denominator
- Explorer: the definitions and windows behind every Overview number
- Troubleshooting: what to check when a number reads as no data
- Your first scan: what has to run before there is anything to read
Last verified 2026-09-29