Analytics
Dashboards and sharing
Save Explorer queries as views, lay them out on dashboards, export a result, and share a frozen, expiring snapshot by link.
Save a query as a view
A saved view is an Explorer query plus the chart
that draws it, kept for everyone on the project. Build the query, choose
Save view at the top of the page, type a name and choose Save. Owners and editors
can save; viewers can build and read queries but not save them
(api/services/explorer/views.py#create_view).
- A name is 1 to 80 characters, and no two views in a project can share a
name, ignoring case (
api/services/explorer/views.py#clean_name,api/schemas/explorer.py#NAME_MAX_LEN). - A project can keep up to 100 saved views; the next is refused until one
is deleted (
api/schemas/explorer.py#MAX_VIEWS). - A view saved with a 7, 28 or 90 day window always shows the latest days when it runs; a view saved with a custom window stays on its dates.
Explorer → Saved views lists every view with its chart, when it last
changed and whether it needs repair. Opening one loads the builder on it
and runs it. Change the query and choose Save changes to update the
view for everyone, on every dashboard that holds it; Open in the
Explorer takes your changed query to a new, unsaved Explorer page instead.
Owners and editors can also rename and delete a view. Deleting it removes it
from every dashboard it is on (api/services/explorer/views.py#update_view,
#delete_view).
Each save moves a view to a new version. If someone else saved the view
after you opened it, your save is refused rather than overwriting theirs:
reload to see their version, or open your changes in the Explorer and save
them as a new view (api/services/explorer/views.py#VIEW_CHANGED). A
rename on its own never re-checks the saved query, so a view that needs
repair can still be renamed.
Views that need repair
A saved view is checked against the project every time it is read, because
the things it names can change after it was saved: a tag or prompt it
filters on is deleted, a competitor it filters on is paused or removed, a
language it filters on stops being supported, or the stored query no longer
matches the Explorer's format. Such a view is flagged needs repair, with
each problem written out, in the list, on its own page and on every
dashboard that holds it. Running it is refused with the same problems until
someone edits the query so it runs and saves it, or until what it names is
valid again, a competitor reactivated for example, which clears the flag
with no edit because the check runs on every read
(api/services/explorer/views.py#read_views, #load_view_query). Nothing
else stops working: a dashboard with one view needing repair still runs its
other views.
Dashboards
A dashboard lays saved views out on one page. It is the Dashboards tab under Explore in the sidebar, beside Explorer.
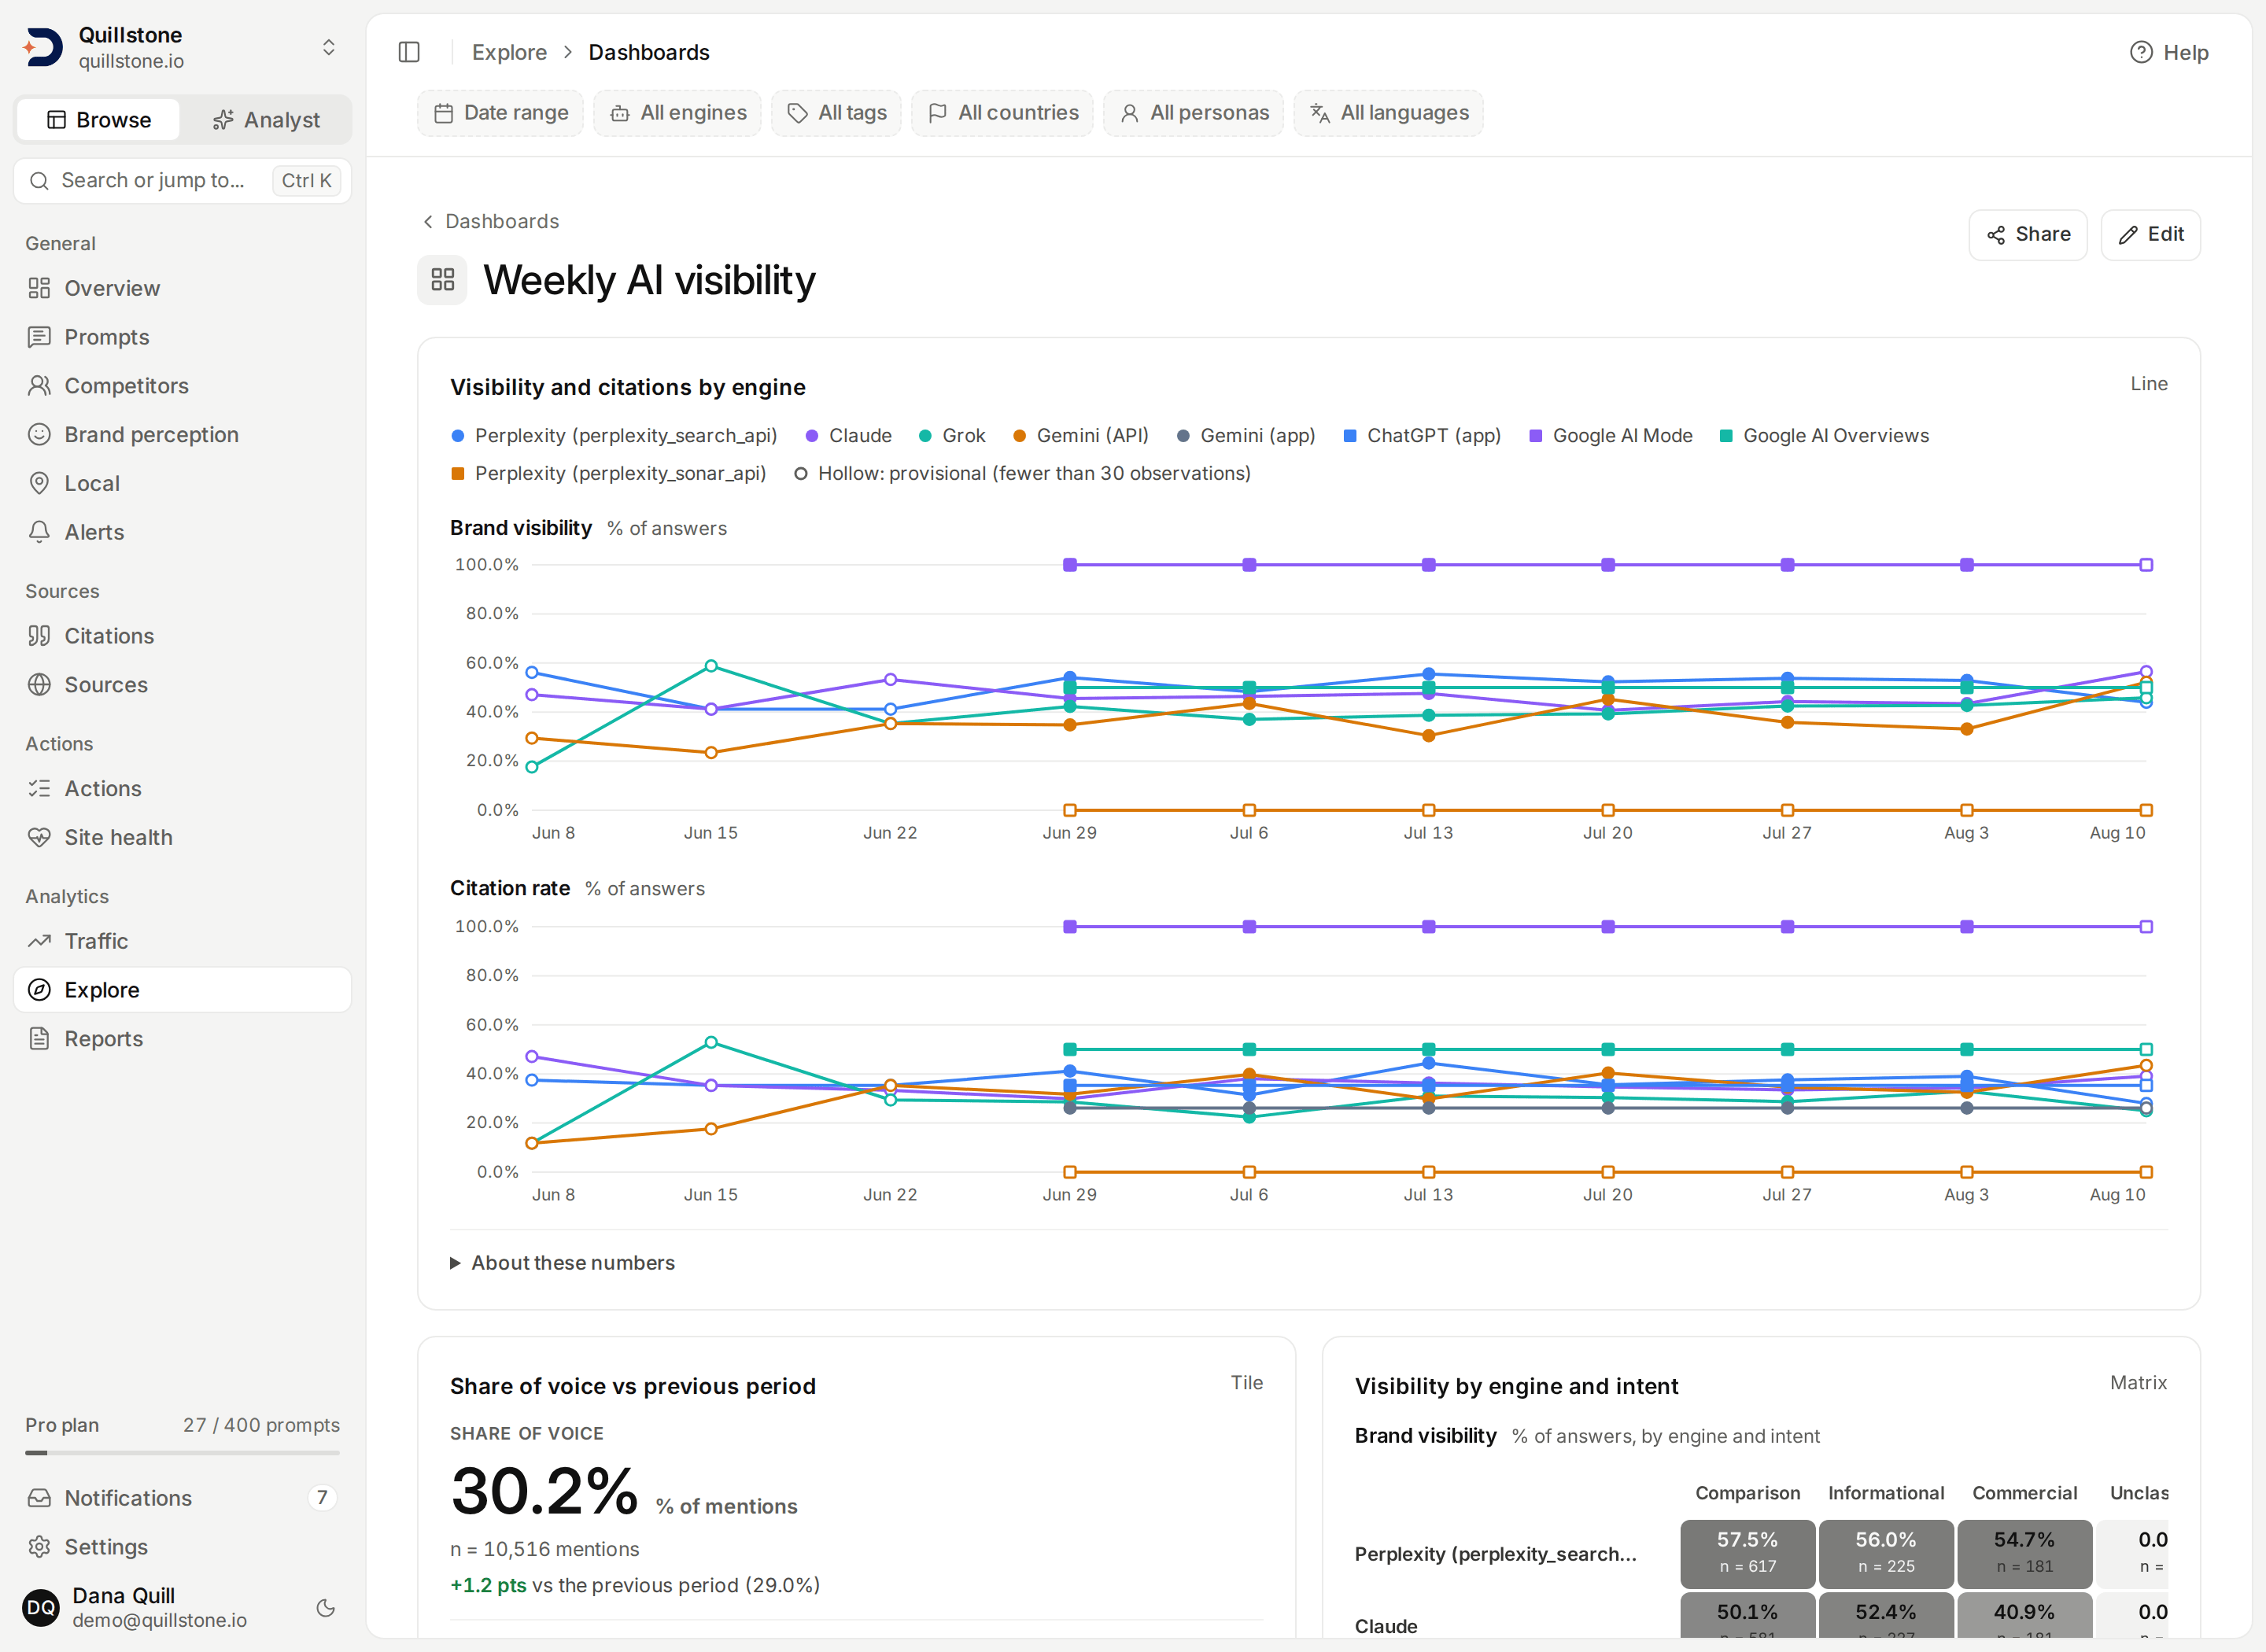
The ChatGPT (app) and Gemini (app) rows in this screenshot are demo data: fixed fictional responses run through the product's own collection code.
- A project can keep up to 20 dashboards, and a dashboard holds up to 12
saved views, each view at most once
(
api/schemas/explorer.py#MAX_DASHBOARDS,#MAX_TILES,api/services/explorer/dashboards.py#_tile_problems). - Names follow the same rules as view names.
- Owners and editors create, edit and delete dashboards; every member can
read them (
api/services/explorer/dashboards.py#create_dashboard,#delete_dashboard).
On a wide screen the views sit in two columns; each is half or full width.
Edit lets an owner or editor add a saved view, remove one, move one up
or down and switch its width, then Save dashboard. The whole list is
saved at once, and the same version check as a view applies, so two people
editing one dashboard cannot silently overwrite each other
(api/services/explorer/dashboards.py#update_dashboard). Deleting a
dashboard keeps its saved views.
Every time a dashboard opens, each view on it that does not need repair
runs, one query each from
the project's query budget,
and one failing view never stops the page
(frontend/src/routes/(app)/dashboards/[id]/+page.server.js#load). A view
that needs repair shows its problems and a link to fix it instead of a
chart; a view that could not run shows why. Each view's chart has an
About these numbers section with its notes. A line chart draws its 10
busiest lines; unlike the Explorer page, a dashboard does not list every
row under the chart.
Export a result
Export at the top of the Explorer page downloads the query's result
as a CSV or JSON file
(api/routers/explorer.py#export_explorer). The query runs again when you
export, so the file is the result at that moment, and it counts against the
query budget. Exporting needs the project owner's data-export entitlement,
the same one the Exports screen uses (standard
Trial, Starter, Growth and Pro); any member can export, viewers included
(api/services/entitlements.py#get_entitlements).
The file is long format: one line per result row and metric, so a file
with several metrics still has one value column. The columns are
<dimension>, <dimension>_label and <dimension>_values_total for each
breakdown, in order, then period, partial, metric, value,
observations, unit, provisional, prior_value, prior_observations,
delta, compare_start and compare_end. A <dimension> column holds
the Explorer's own key, such as a tag, persona or brand id or a prompt's
public id; the label column holds its name
(api/services/explorer/export.py#explorer_rows, #VALUE_COLUMNS).
Both formats are written the way every other export is: the CSV with a
byte order mark and the formula guard on each cell, the JSON as an object
with dataset set to explorer, generated_at, columns, row_count and
the query's window (api/services/explorer/export.py#render_export,
api/services/exports/base.py#render_csv, #render_json, #sanitise_cell).
The file name is discoveredby-{project}-explorer-{start}-{end} with the
extension of the format.
The file says when it is not the whole picture. When a breakdown was cut
to its 25 values with the most observations, that breakdown's
<dimension>_values_total column holds how many values there were before
the cut; it is empty when nothing was cut. With a comparison, every line's
compare_start and compare_end give the dates prior_value and delta
were compared with; both are empty without one. The JSON file carries the
same context once more at the top level: compare_window (its start and
end, or null), truncated (each cut breakdown and its total before the
cut) and notes, the notes the Explorer shows under the result. The CSV
has no place for the notes, so keep them alongside a CSV file
(api/services/explorer/export.py#render_export). There is no row-count
refusal like the Exports screen's; the size is bounded by the Explorer's
own limits. Each export is recorded in project activity with the format,
row count and window.
Share a snapshot by link
A share link shows a saved view or a dashboard to someone without a DiscoveredBy account. It is a frozen snapshot: the results as they were when the link was made, never a live query, and it never updates.
Share is on a saved view's page and on a dashboard that holds at least
one view. It is shown to owners and editors, and creating a link needs the
project owner's weekly-report entitlement, the same one
Client report links use (standard Starter,
Growth and Pro) (api/services/report_shares.py#require_report_access).
An unsaved Explorer query cannot be shared; save it as a view first. A
view's link shares the view as saved, not unsaved edits on screen.
- The dialog builds a preview: exactly what the link will show.
- Give the link a label of 1 to 80 characters and choose an expiry of 1, 7 or 30 days; 7 is preselected.
- Confirm you reviewed the snapshot, then choose Create link.
If the results changed between the preview and creation, creation is
refused until you preview again, so what you reviewed is what is shared.
A project can have 20 active links at once, and a snapshot larger than
1 MiB is refused (api/services/explorer/shares.py#preview_share,
#create_share, #fingerprint, #MAX_ACTIVE_SHARES, #MAX_SNAPSHOT_BYTES,
api/schemas/explorer.py#ShareCreate). The preview and the creation each
run every view in the snapshot that does not need repair, so sharing a
12-view dashboard spends up to 24 queries from the budget.
The full link is shown once. Only a hash of its secret is stored, so it
cannot be shown again; create another link if it is lost. The secret sits
after the # in the address, which a browser never sends to a server.
Anyone holding the link can open it and forward it.
What someone opening the link sees
The project's name and the view or dashboard name as they were when the
link was made, when the snapshot was taken, when the link expires, then
each view: its name, its filters by name, its chart and its notes. A
dashboard's views that needed repair or could not run when the snapshot
was taken are left out and named at the bottom; a dashboard with no view
that could run cannot be shared at all
(api/services/explorer/shares.py#build_snapshot,
api/schemas/explorer.py#ExplorerSnapshot).
The snapshot carries no ids: each row's key is replaced by a
per-snapshot placeholder and each filter value by its name, so no prompt
id, tag, persona or brand id, or engine channel key leaves the project
(api/services/explorer/shares.py#_public_result, #_public_query,
api/schemas/explorer.py#PublicResult, #PublicFilter). Like a
dashboard, the page draws each chart without the full row table beneath
it. It needs JavaScript and is served with no caching, no referrer and a
request not to be indexed (api/main.py#protect_report_sharing).
Revoke a link, and when a link stops opening
Links on this project in the share dialog lists the project's links,
active ones first, then the most recent, up to 100. Revoke stops a link
opening for everyone at once. It cannot take back a copy someone already
saved or a page already open (api/services/explorer/shares.py#list_shares,
#revoke_share, #SHARE_LIST_LIMIT).
Every time a link is opened it is checked again: it must be unexpired and
unrevoked, its creator must still be an active user with owner or editor
access to the project, the project must be active, and the project owner
must be active with weekly-report access. A link that fails any check shows
the same "This link is unavailable" page, whatever the reason
(api/services/explorer/shares.py#resolve_share,
api/services/report_shares.py#eligible_share_project,
frontend/src/routes/share/explorer/+page.svelte#UNAVAILABLE). Restoring
the owner's plan or the creator's role lets an unexpired, unrevoked link
open again. Deleting the view or dashboard afterwards does not close a link:
the snapshot is stored with the link. Creating and revoking links are
recorded in project activity.
Read the Explorer from your own tools
The customer API and the
MCP connector can run Explorer queries and saved views
with a key that has the opt-in explorer:read permission, on plans with the
customer API (api/schemas/customer_api.py#ReadScope). They read; they
cannot save views, edit dashboards or create links. A query run this way
spends both the key's own request limit and the project's Explorer budget
(api/services/customer_api.py#explorer_query, #explorer_view_result,
api/services/customer_mcp.py#query_metrics, #run_explorer_view).
Related
- Explorer: metrics, dimensions, population rules and limits
- Client report links: the weekly digest links that share the same plan gate
- Exports and activity: the dataset downloads and where exports and link changes are recorded
- Team: owner, editor and viewer roles
Last verified 2026-09-28