Analytics
Explorer
Build your own chart from twenty-one metrics, including the Google shown rate, organic rank, answers citing sources and answer features, fourteen breakdowns and filters, a window, a comparison and smoothing, with the population rules and limits behind every number.
What the Explorer does
The Explorer builds a chart of your own from a project's collected answers and runs: pick up to five metrics, break them down by up to two dimensions, filter by up to eight, choose a window, a time grain, a comparison and optional seven-day smoothing, and draw the result as a line, bar, matrix, table or single-number tile. It is the Explorer tab under Explore in the sidebar. Saved views, dashboards and share links are built on top of it, and so is Analyst, which plans and runs Explorer queries for a question asked in plain words.
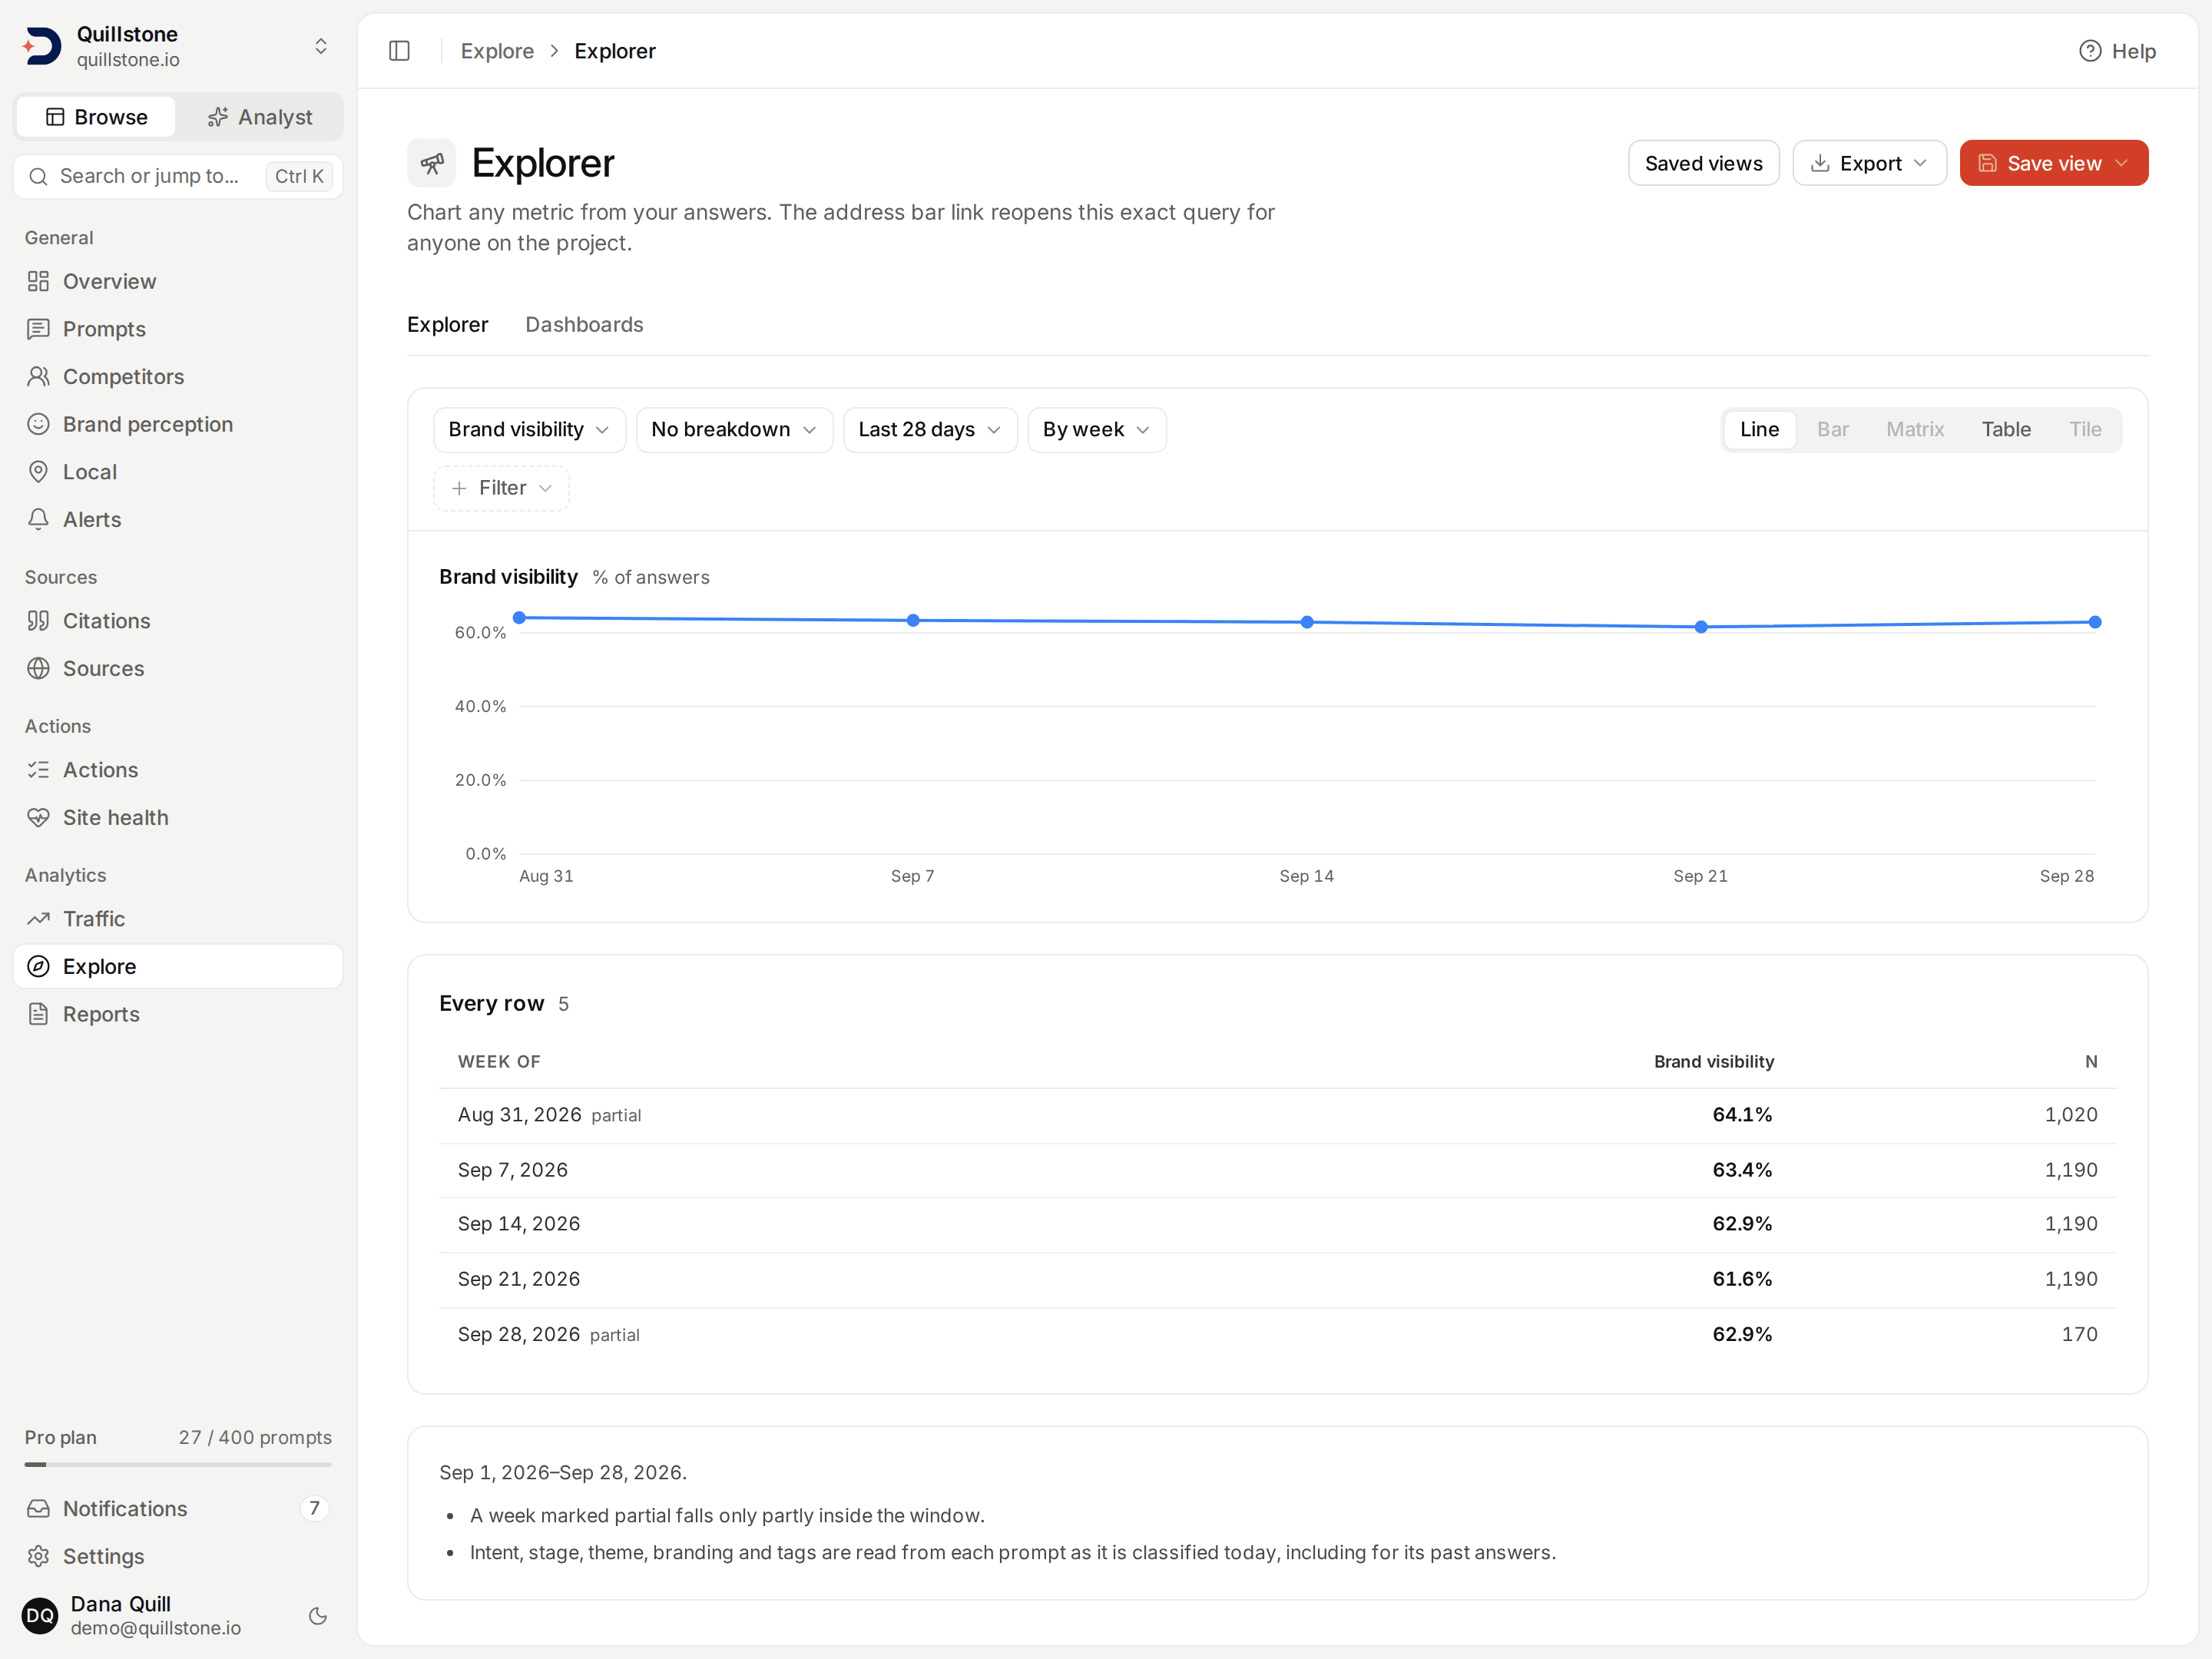
The numbers in this screenshot are demo data: fixed fictional responses run through the product's own collection and detection code.
The Explorer is on every plan, with no entitlement of its own. Every member
of a project, viewers included, can build and run queries; saving a query
as a view needs owner or editor access
(api/routers/explorer.py#query_explorer, #_writable_project,
frontend/src/routes/(app)/explorer/+page.svelte#writable). The query you
are looking at lives in the page's address as a ?q= value, so copying the
address gives another project member the same query. It is a link into the
app, not a public link: it still needs a signed-in member of the project
(frontend/src/lib/components/explorer/explorer.js#encodeQuery).
Overview reads the Explorer. Every metric on it is the result of
Explorer queries built in code, over the same 7, 28 or 90 day windows
ending yesterday, so over the same window the two screens agree. Only the
five headline numbers and the brand ranking are also compared with the same
number of days immediately before; the top sources and the trend have no
earlier period
(api/services/overview.py#build_summary,
api/services/explorer/query.py#execute_queries). Its Visibility, Share of
voice and Avg. position are brand visibility, share of voice and brand
position for your own brand family; its Cited is citation rate; its
Positive sentiment is positive sentiment filtered to the one engine channel
with the most analysed answers in the window (among the chosen engine's
channels when the filter bar has one); its brand ranking is the
three brand metrics broken down by brand; its top sources are domain
citation rate broken down by domain; and its trend is brand visibility,
share of voice, brand position or positive sentiment as a daily or weekly
series, broken down by brand or by engine
(api/services/overview.py#_trend_query). The filter bar's engine, tag,
country, persona and language ride inside every one of those queries as
Explorer filters, so Open in Explorer in the trend's menu opens the
chart's own query here with them applied, and its CSV carries them too
(api/services/answer_filters.py#explorer_filters). See
Reading your first results
for the Overview screen itself.
The domain-citation share of voice
on the Competitors page is a separate calculation and not an Explorer
metric: it counts citations by domain rather than brand mentions
(api/routers/pages.py#competitors_page).
The twenty-one metrics
| Metric | Formula | Unit of its observations |
|---|---|---|
| Answers collected | Completed answers in the window | answers |
| Answers analysed | Completed answers whose brand extraction has finished | answers |
| Brand visibility | Analysed answers naming the brand family ÷ analysed answers | answers |
| Brand position | Mean, over answers naming the family, of the family's earliest position in each answer; lower is better | answers naming the family |
| Share of voice | The family's (answer, family) pairs ÷ the pairs of every tracked active family | mentions |
| Citation rate | Collected answers with a saved citation of your own domain ÷ collected answers | answers |
| Answers citing sources | Collected answers with at least one saved citation, of any domain ÷ collected answers, Claude, Grok and pre-Sonar Perplexity answers, and Gemini (app) answers whose only sources are Google product or place links, left out | answers |
| Retrieval coverage | Collected answers whose recorded search results include your own domain ÷ collected answers, Google, ChatGPT (app) and Gemini (app) answers left out | answers |
| Positive sentiment | Positive mention records of the family ÷ its classified mention records | mention records |
| Negative sentiment | Negative mention records of the family ÷ its classified mention records; lower is better | mention records |
| Domain citation rate | Collected answers citing the domain at least once ÷ collected answers | answers |
| AI answer shown rate | Google AI Overviews and Google AI Mode runs that showed an AI answer ÷ those runs | Google runs |
| First-page organic rate | Google AI Overviews runs where the domain appears on the first page of organic results ÷ Google AI Overviews runs | AI Overview runs |
| Organic position | Mean, over the Google AI Overviews runs where the domain appears on the first page of organic results, of its best organic position in each run; lower is better | ranking runs |
| Answers using web search | Checked answers in which the engine searched the web ÷ checked answers, on the API engines, ChatGPT (app) and Gemini (app) | checked answers |
| Answers with shopping | Checked answers that held products ÷ checked answers, on Google AI Overviews, ChatGPT (app) and Gemini (app) | checked answers |
| Answers with local businesses | Checked answers that held local businesses ÷ checked answers, on ChatGPT (app) and Gemini (app) | checked answers |
| Answers with ads | Checked answers that held an ad ÷ checked answers, on Google AI Overviews and ChatGPT (app) | checked answers |
| Answers with video | Checked answers that held a video part or linked a YouTube video ÷ checked answers, on Google AI Overviews | checked answers |
| Answers with images | Checked answers that held images ÷ checked answers, on ChatGPT (app) and Gemini (app) | checked answers |
| Answers with tables | Checked answers that held a table ÷ checked answers, on Google AI Overviews, ChatGPT (app) and Gemini (app) | checked answers |
These come from one definition table and one SQL statement per metric
(api/services/explorer/metrics.py#METRICS, #compute_raw). The details
that decide what a number means:
- Two denominators. Brand visibility, position, share of voice, both
sentiment metrics and Answers analysed read only analysed answers, those
whose brand extraction has finished. Citation rate, answers citing
sources, retrieval coverage and domain citation rate read every collected
answer
(
api/services/explorer/metrics.py#_runs). Answers collected and a brand metric side by side are two different populations; see Collected versus analysed answers. - Once per answer. A family counts once per answer however many of its
names or sub-brands appear; a domain counts once per answer however many
of its pages are cited (
api/services/explorer/metrics.py#_visibility_statement,#_share_of_voice_statement,#_domain_statement). - Position is one value per answer: the earliest position at which any
member of the family is named. It is averaged over the answers that named
the family, so an answer that never names it adds nothing
(
api/services/explorer/metrics.py#_position_statement). - Sentiment counts mention records, not answers: positive (or negative)
records divided by records classified positive, neutral or negative. A
record with no sentiment yet is left out of both sides. A family sums the
records of its members, archived sub-brands included
(
api/services/explorer/metrics.py#_sentiment_statement). - Retrieval coverage is the metric Metrics defined calls domain coverage: a page pulled into an engine's context, whether or not the answer then linked it.
- Domain citation rate counts any saved citation of the domain, yours or anyone's.
- Answers citing sources counts an answer that cited anything at all.
It leaves out Claude and Grok answers and Perplexity answers collected
before Sonar, whose saved citations include every search result, so it has no
value for them, and a result with this metric carries a note saying so
(
api/services/collection.py#SURFACES_WITHOUT_ANSWER_CITATIONS,api/services/explorer/query.py#NOTE_SOURCED_ANSWERS). It also leaves out Gemini (app) answers whose only sources are Google product or Google Maps place links: they list sources, but none is a web page counted as a citation (api/services/collection.py#SURFACES_WITH_UNCITED_SOURCES). The note reads: "Answers citing sources leaves out Claude and Grok answers and Perplexity answers collected before Sonar: their saved citations include every search result, not only the sources the answer cites. It also leaves out Gemini (app) answers whose only sources are Google product or Google Maps place links: they list sources, but none is a web page we count as a citation." An answer with no sources is one where the engine showed none; on ChatGPT (app) and Gemini (app), which decide for themselves whether to search, that usually means they did not search (see Metrics defined). - Runs. The last three count runs: completed answers plus runs where
Google showed no AI answer
(
api/services/explorer/metrics.py#RUN_METRICS). Every other metric reads completed answers only, so a run with no AI answer never enters them. AI answer shown rate counts only Google AI Overviews and Google AI Mode runs; the chat engines, ChatGPT (app) and Gemini (app) always answer, so they have no value there, and the result carries a note saying so (api/services/explorer/query.py#NOTE_ANSWER_SHOWN). The two organic metrics read only Google AI Overviews runs, shown or not, and have no value for any other engine; a run with no organic result for the domain still counts in the rate's denominator, and a domain that never ranks has no organic position (api/services/explorer/metrics.py#_organic_statement). See Runs and the Google engines. - Retrieval coverage leaves out answers from the two Google engines,
ChatGPT (app) and Gemini (app), which report no retrieved pages, so their rows have no
value rather than a measured 0%
(
api/services/collection.py#SURFACES_WITHOUT_RETRIEVAL). - Answer features. The last seven, grouped as Answer features in
the builder, divide by checked answers: completed answers on an engine
that reports the feature, checked for it. An engine that does not report
a feature has no value there, never 0%: Google AI Mode reports none,
Google AI Overview images are not reported, web search is blank for
Google AI Overviews and AI Mode, and Gemini (app) reports no ads or
video. Answers not checked yet, API-engine answers whose searches were
not recorded, and Gemini (app) answers whose product or place links were
listed for another country (for shopping or local businesses), are left
out of both sides. A result with any of them carries a note naming which
engines report which feature
(
api/services/explorer/metrics.py#_runs,#_statement,api/services/explorer/query.py#NOTE_ANSWER_FEATURES). The note reads: "Answer features count only the engines that report them: shopping, ads, video and tables on Google AI Overviews (video when Google sends a video part or links a YouTube video; ads and tables when Google sends them as their own part of the answer, which has not happened in our live checks); shopping, local businesses, ads, images and tables on ChatGPT (app); shopping, local businesses, images and tables on Gemini (app) (shopping and local businesses from the Google product and place links among its sources; images when sent as their own part of the answer, which has not happened in our live checks); web search on the API engines, ChatGPT (app) and Gemini (app). Google AI Mode reports no feature we can count, AI Overview images are not reported, and web search is blank for Google AI Overviews and AI Mode. A Gemini (app) answer whose product or place links were listed for another country is left out of its shopping or local businesses rate. Other engines have no value." See Answer features.
Rates are percentages to one decimal place; position is a mean to one
decimal place. Answer counts are whole numbers, except under seven-day
smoothing (below). A group with nothing in its denominator has no
value, drawn as an en dash, never as 0
(api/services/explorer/metrics.py#metric_value). A rate or position built
from fewer than 30 observations is marked provisional: a hollow dot on a
line, a hatched bar or matrix cell, or the word "provisional" in a table or
tile. An answer count is exact and is never provisional
(api/services/explorer/query.py#_cell,
api/services/brand_metrics.py#MIN_OBSERVATIONS).
Brands and domains
The brand metrics are brand visibility, brand position, share of voice
and the two sentiment metrics. Their rows are brand families: your own
brand, and each tracked competitor that is active, each with its
sub-brands folded in. A sub-brand is never a row of its own here
(api/services/explorer/metrics.py#_brand_entities).
- A brand metric with no brand breakdown and no brand filter reads your own brand. A brand filter with one value and no breakdown reads that family. A brand filter with more than one value needs brand as a breakdown, because pooling two families into one number means nothing.
- A brand breakdown or filter works only when every metric in the query is a brand metric.
- Every family the query allows gets a row in every group that has
answers, including a family never named there. That row reads as a
measured 0% for brand visibility, and for share of voice when other
families were named in that group. For position and sentiment the row
has no value, since there is no answer naming the family or no mention
record to divide by; the same goes for share of voice in a group where
no tracked family was named
(
api/services/explorer/metrics.py#_visibility_statement,#_position_statement,#_sentiment_statement). - The brand filter never narrows share of voice. Its denominator is
always every tracked active family's pairs in that group; the filter only
chooses which families' rows are shown. Unfiltered, the families' shares
in one group add up to 100%, give or take rounding. A paused or removed
competitor leaves the Explorer's brand rows and the share-of-voice
denominator at once; an archived sub-brand keeps counting for its
still-active family, and a name you never added as a brand never counts
(
api/services/explorer/metrics.py#_share_of_voice_statement).
Domain citation rate needs a domain breakdown or a domain filter;
without one the query is refused. A domain filter with more than one value
needs domain as a breakdown. The domain dimension works only with domain
citation rate, the two organic metrics and the two answer counts; with an
answer count it counts the answers citing that domain, and a group where
the domain was never cited is left out rather than shown as zero
(api/services/explorer/query.py#query_problems, #_measured). With no
domain filter, a domain breakdown lists every domain cited in the window,
subject to the 25-value cap below. The two organic metrics read your own
domain with no domain breakdown or filter, and each domain with one; with
a domain breakdown they list every domain with an organic result in the
window, whether or not it was ever cited
(api/services/explorer/metrics.py#_organic_statement).
The fourteen dimensions
Each dimension can be a breakdown (one row per value), a filter, or both;
as both, the filter narrows which rows appear
(api/services/explorer/dimensions.py#DIMENSIONS, #execution_key).
| Dimension | One value is | Shown as |
|---|---|---|
| Engine | One collection channel: the provider plus the platform, surface and collection method recorded on the answer | The provider's name; the channel is added in parentheses only when one provider has more than one channel in the result |
| Model | The model recorded on the answer | As recorded; "Unrecorded" when empty |
| Country | The prompt target's country | Country name |
| City | The prompt target's city, or Country-wide for a target with no city | "London, GB", or Country-wide |
| Persona | General, or one persona, archived ones included | Persona name, or General |
| Language | As written, or one language code | Language name, or As written |
| Intent, Buying stage, Theme, Branding | The prompt's classification, or Unclassified | The classification's name |
| Tag | One of the project's tags, or No tag | Tag name |
| Prompt | One tracked prompt | The first 200 characters of its current text |
| Brand | Your brand family or an active competitor family | Brand name |
| Domain | A cited domain, or, for the organic metrics, a domain with an organic result | The domain |
Two channels of one provider, an API call and a browser capture say, are
two engine values and are never pooled into one row
(api/services/explorer/dimensions.py#engine_key,
api/services/explorer/labels.py#engine_labels, #SENTINEL_LABELS,
#PROMPT_LABEL_CHARS). See
Intent, buyer stage, theme and branding
for what the four classifications mean.
The filter picker lists: engines and models seen in completed answers in
the last 366 days; the countries of the project's prompt targets;
Country-wide (when some target has no city) and every city a target of the
project uses; General
and every persona, archived ones flagged; the languages in use on the
project's targets; the fixed classification values; every tag plus No
tag; your brand and every active competitor family; the 100 most-cited
domains of the last 90 days, and, while an organic metric is selected, the
domains that ranked in Google's organic results over the same days
alongside them, still 100 in all; and every prompt
(api/services/explorer/dimension_values.py#available_values,
#SEEN_DAYS, #DOMAIN_DAYS, #DOMAIN_LIMIT, #FIXED_VALUES,
#_target_cities, #_ranked_domains).
A filter value is checked against the project before the query runs. A
country must be one of the project's target countries; a city must be
Country-wide or a city some target of the project uses, so a city that
exists but that no target here uses is refused; a persona, tag or
prompt must be the project's own; a brand must be your own brand or an
active competitor family; a classification or language
value must be one of the fixed values; a domain must have been cited for
the project at least once, even outside the picker's 90 days, or, in a
query with an organic metric, have ranked in an organic result for it. Anything else
refuses the query with the unknown values named, and another project's id
reads exactly like one that never existed. Engine and model values are not
checked: one this project never recorded simply matches nothing
(api/services/explorer/query.py#unknown_values).
Which answers are counted
- Completed answers only, placed in the window by the date they were collected, except for the three run metrics, which also count runs where Google showed no AI answer.
- Paused prompts and targets count when they have answers in the
window. A deleted prompt's answers are gone
(
api/services/explorer/population.py#Population). - Classification and tags are today's. Intent, buying stage, theme, branding and tags are read from each prompt as it is classified now, including for its past answers. Every result carries a note saying so.
- A persona or language breakdown keeps every chat engine. Every chat
engine a prompt runs on, Perplexity included, runs its persona and
language variants. Google AI Overviews, Google AI Mode, ChatGPT (app)
and Gemini (app) never run a persona variant or a Chinese variant, so a
persona's row, or Chinese's, holds no answers from them, and ChatGPT
(app) never runs a city target, so a city's row holds no ChatGPT (app)
answers (Gemini (app) does run city targets)
(
api/services/explorer/metrics.py#_runs,api/services/collection.py#target_runs_on). - Engines are pooled unless engine is a breakdown or a filter.
- Sentiment is read within one channel. A sentiment metric needs engine
as a breakdown or an engine filter with exactly one value; otherwise the
query is refused with "Sentiment is compared within one engine. Break
down or filter by engine."
(
api/services/explorer/metrics.py#SENTIMENT_CHANNEL_MESSAGE). - Tag rows overlap. A prompt with several tags counts once under each
of them, so tag rows do not add up to the total; a tag breakdown carries
a note saying so (
api/services/explorer/query.py#_notes).
Limits on a query
| Setting | Allowed |
|---|---|
| Metrics | 1 to 5, each once |
| Breakdowns | 0 to 2; at most 1 with a time grain |
| Filters | 0 to 8, one per dimension, 1 to 25 values each |
| Window | 7, 28 or 90 days ending yesterday, or a custom start and end ending yesterday or earlier, at most 366 days |
| Time grain | None, day (a window of at most 92 days) or week (ISO weeks, Monday to Sunday) |
| Values per breakdown | 25 |
(api/schemas/explorer.py#ExplorerQuery, #MAX_METRICS, #MAX_BREAKDOWNS,
#MAX_FILTERS, #MAX_FILTER_VALUES,
api/services/explorer/query.py#resolve_window, #MAX_WINDOW_DAYS,
#MAX_DAY_GRAIN_DAYS, #AXIS_CAP.) "Yesterday" is by the server's
calendar. A 7, 28 or 90 day window always ends on the latest yesterday, so
the same query moves forward each day; a custom window stays on its dates.
With a weekly grain, a week that falls only partly inside the window is
marked partial. A breakdown keeps its 25 values with the most observations
of the first metric, then by name; when it had more, the result says how
many there were, and a filter shows the others. The date axis is never cut
(api/services/explorer/query.py#_assemble).
A query that breaks a rule is refused with every problem listed at once,
not only the first (api/services/explorer/query.py#query_problems).
Charts
| Chart | Needs |
|---|---|
| Line | A daily or weekly grain and at most one breakdown. Draws the 10 lines with the most observations; a table lists every row |
| Bar | No grain and one or two breakdowns; with two, the bars are grouped under the first breakdown's values |
| Matrix | No grain, exactly two breakdowns and exactly one metric: a heatmap whose cells show the value and its observations |
| Table | Anything |
| Tile | No grain, no breakdowns and one metric: a single number, with its change when a comparison is on |
The query is the same whichever chart draws it. The builder greys out a
chart that cannot draw the current query and says why, and when a change
makes the current chart impossible it switches to one that fits, the table
if nothing else does (api/services/explorer/charts.py#chart_problems,
frontend/src/lib/components/explorer/explorer.js#chartProblems, #fitChart,
#MAX_LINE_SERIES). Several metrics on a line or bar chart are drawn as one
panel per metric, each captioned with its unit
(frontend/src/lib/components/explorer/explorer.js#metricCaption).
A line chart leaves lines out past its first 10, and with only one day or
week in the window it has no line to draw. In the Explorer and on a saved
view the full table of rows is always under the chart. On a dashboard tile
and on a shared snapshot, which show no table otherwise, the table appears
right under the line whenever the line leaves something out
(frontend/src/lib/components/explorer/ExplorerChart.svelte#lineLeavesSomethingOut).
Comparing with an earlier period
Compare with offers None, Previous period (the same number of days
immediately before the window) and Last year (both ends moved back 364
days, so weekdays and ISO weeks line up)
(api/services/explorer/query.py#compare_window, #YEAR_SHIFT).
With a comparison on, each value gains the earlier period's value, its
observations and the change between them: in percentage points for a rate,
a plain difference for an answer count or a position. A falling position
is an improvement. The change is empty when either side has no value
(api/schemas/explorer.py#MetricCell, api/services/explorer/query.py#_cell).
In a time series the n-th day or week of the earlier period is paired with
the n-th of the window (api/services/explorer/query.py#_align). With a
weekly grain, a week that is partial in either window keeps its earlier
value but has no change, because it would compare a different number of
days, and a note under the result says so
(api/services/explorer/query.py#partial_week, #NOTE_PARTIAL_WEEK_CHANGE). Rows come
from the window itself, so a value that had answers only in the earlier
period has no row.
A comparison uses the engines you select, in both periods. Pooled over every engine, it includes an engine that started answering during the window, such as ChatGPT (app) or Gemini (app) when it was added, on one side only; break the result down by engine, or filter to one, to compare like for like.
Seven-day smoothing
With a daily grain, 7-day average turns each point into that day
pooled with the six before it: the sum of the seven days' numerators over
the sum of their denominators, never an average of seven daily rates. A
position is the mean over those days' answers
(api/services/explorer/query.py#_trailing_week). The six days before the
window's first day are read too, so the first point pools a full week.
An answer count under smoothing is the mean per day: the seven days'
total divided by seven, with the total as its observations, so smoothing
never changes the scale of a line (api/services/explorer/query.py#_value).
Days with no answers count as zero in that total, so a count near the
start of a project's history reads low. The 25 values a breakdown keeps are
chosen from the unsmoothed daily numbers inside the window
(api/services/explorer/query.py#_read). A comparison is smoothed the same
way.
Reading a result
Under the chart the Explorer lists every row, then the result's notes: the
window and any comparison window, any breakdown cut to 25 values, partial
weeks, the per-day reading of a smoothed count, and the notes the query
itself returns (current classification always; tag overlap, the provisional threshold and a partial week's missing change
when they apply). On a dashboard tile the notes fold under "About these
numbers", except the sentence about a breakdown cut to 25 values, which
stays in view under the chart
(frontend/src/lib/components/explorer/TruncatedAxes.svelte#truncated,
api/services/explorer/query.py#_notes,
frontend/src/lib/components/explorer/explorer.js#formatValue).
The query budget and time limit
Each project can run 120 Explorer queries a minute, counted in a fixed
one-minute window that opens with the first query
(api/services/explorer/budget.py#charge_budget, #QUERIES_PER_MINUTE).
Everyone on the project shares it, and so does everything that runs a
query: each change in the builder, opening a saved view, every tile each
time a dashboard loads, each export, each tile of a share-link preview and
again when the link is created, and Explorer calls through the customer API
and MCP. Overview counts too: each load charges the budget twice, once for
most of its figures, then once for its default trend and its positive
sentiment figure, and each change to its trend chart once; opening an answer in its drawer does not count
(api/services/overview.py#build_summary, #build_trend). Listing saved
views, dashboards and filter values does not count.
A query is charged before the query checks run, so a query those checks
refuse (an unknown filter value, sentiment without one engine, a window
past yesterday and the like) still counts. A request refused earlier does
not: a body that is not a valid query at all, a missing export
entitlement, an unknown saved view, or a saved view that needs repair
(api/services/explorer/query.py#execute_query,
api/routers/explorer.py#export_explorer, #run_view).
Past the budget, a query is refused with the number of seconds until the
window resets, which the app shows as "Too many queries, try again in" that
many seconds.
A query, all of its statements together, may run for at most 15 seconds:
each statement is allowed only the time the query has left
(api/services/explorer/query.py#bound_statement, #QUERY_SECONDS). A
query that takes longer is refused with "This query took too long. Narrow
the window, filters or breakdowns." (api/services/explorer/query.py#execute_query,
#TIMEOUT_MESSAGE). An Overview charge can cover several queries, and they
share one 15-second limit between them
(api/services/explorer/query.py#execute_queries). Loading the filter values runs under the same
15-second limit and, past it, says "Loading the filter values took too
long. Try again in a moment."
(api/services/explorer/dimension_values.py#available_values,
api/routers/explorer.py#DIMENSIONS_TIMEOUT_MESSAGE). A dashboard runs its
tiles at most three at a time
(frontend/src/routes/(app)/dashboards/[id]/+page.server.js#TILE_CONCURRENCY).
Related
- Dashboards and sharing: saved views, dashboards, exporting a result and public snapshot links
- Analyst: questions in plain words, answered from Explorer queries
- Metrics defined: the same metrics with their history and caveats
- Brands and sub-brands: what a brand family is
- Personas: the audiences a persona breakdown reads
- Customer API and keys: running Explorer queries from your own tools
Last verified 2026-09-28