Features
Analytics
Answer your own questions about the collected answers, and connect AI visibility to your search and site traffic.
Your Own Analysis
Ask the question your dashboard doesn't.
The Explorer, on every plan, lets you build the chart you need from the answers we have already collected: pick the metrics, break them down, filter, choose a window and compare it with an earlier one. Save it for the team, put it on a dashboard, or send a frozen snapshot to someone without an account.
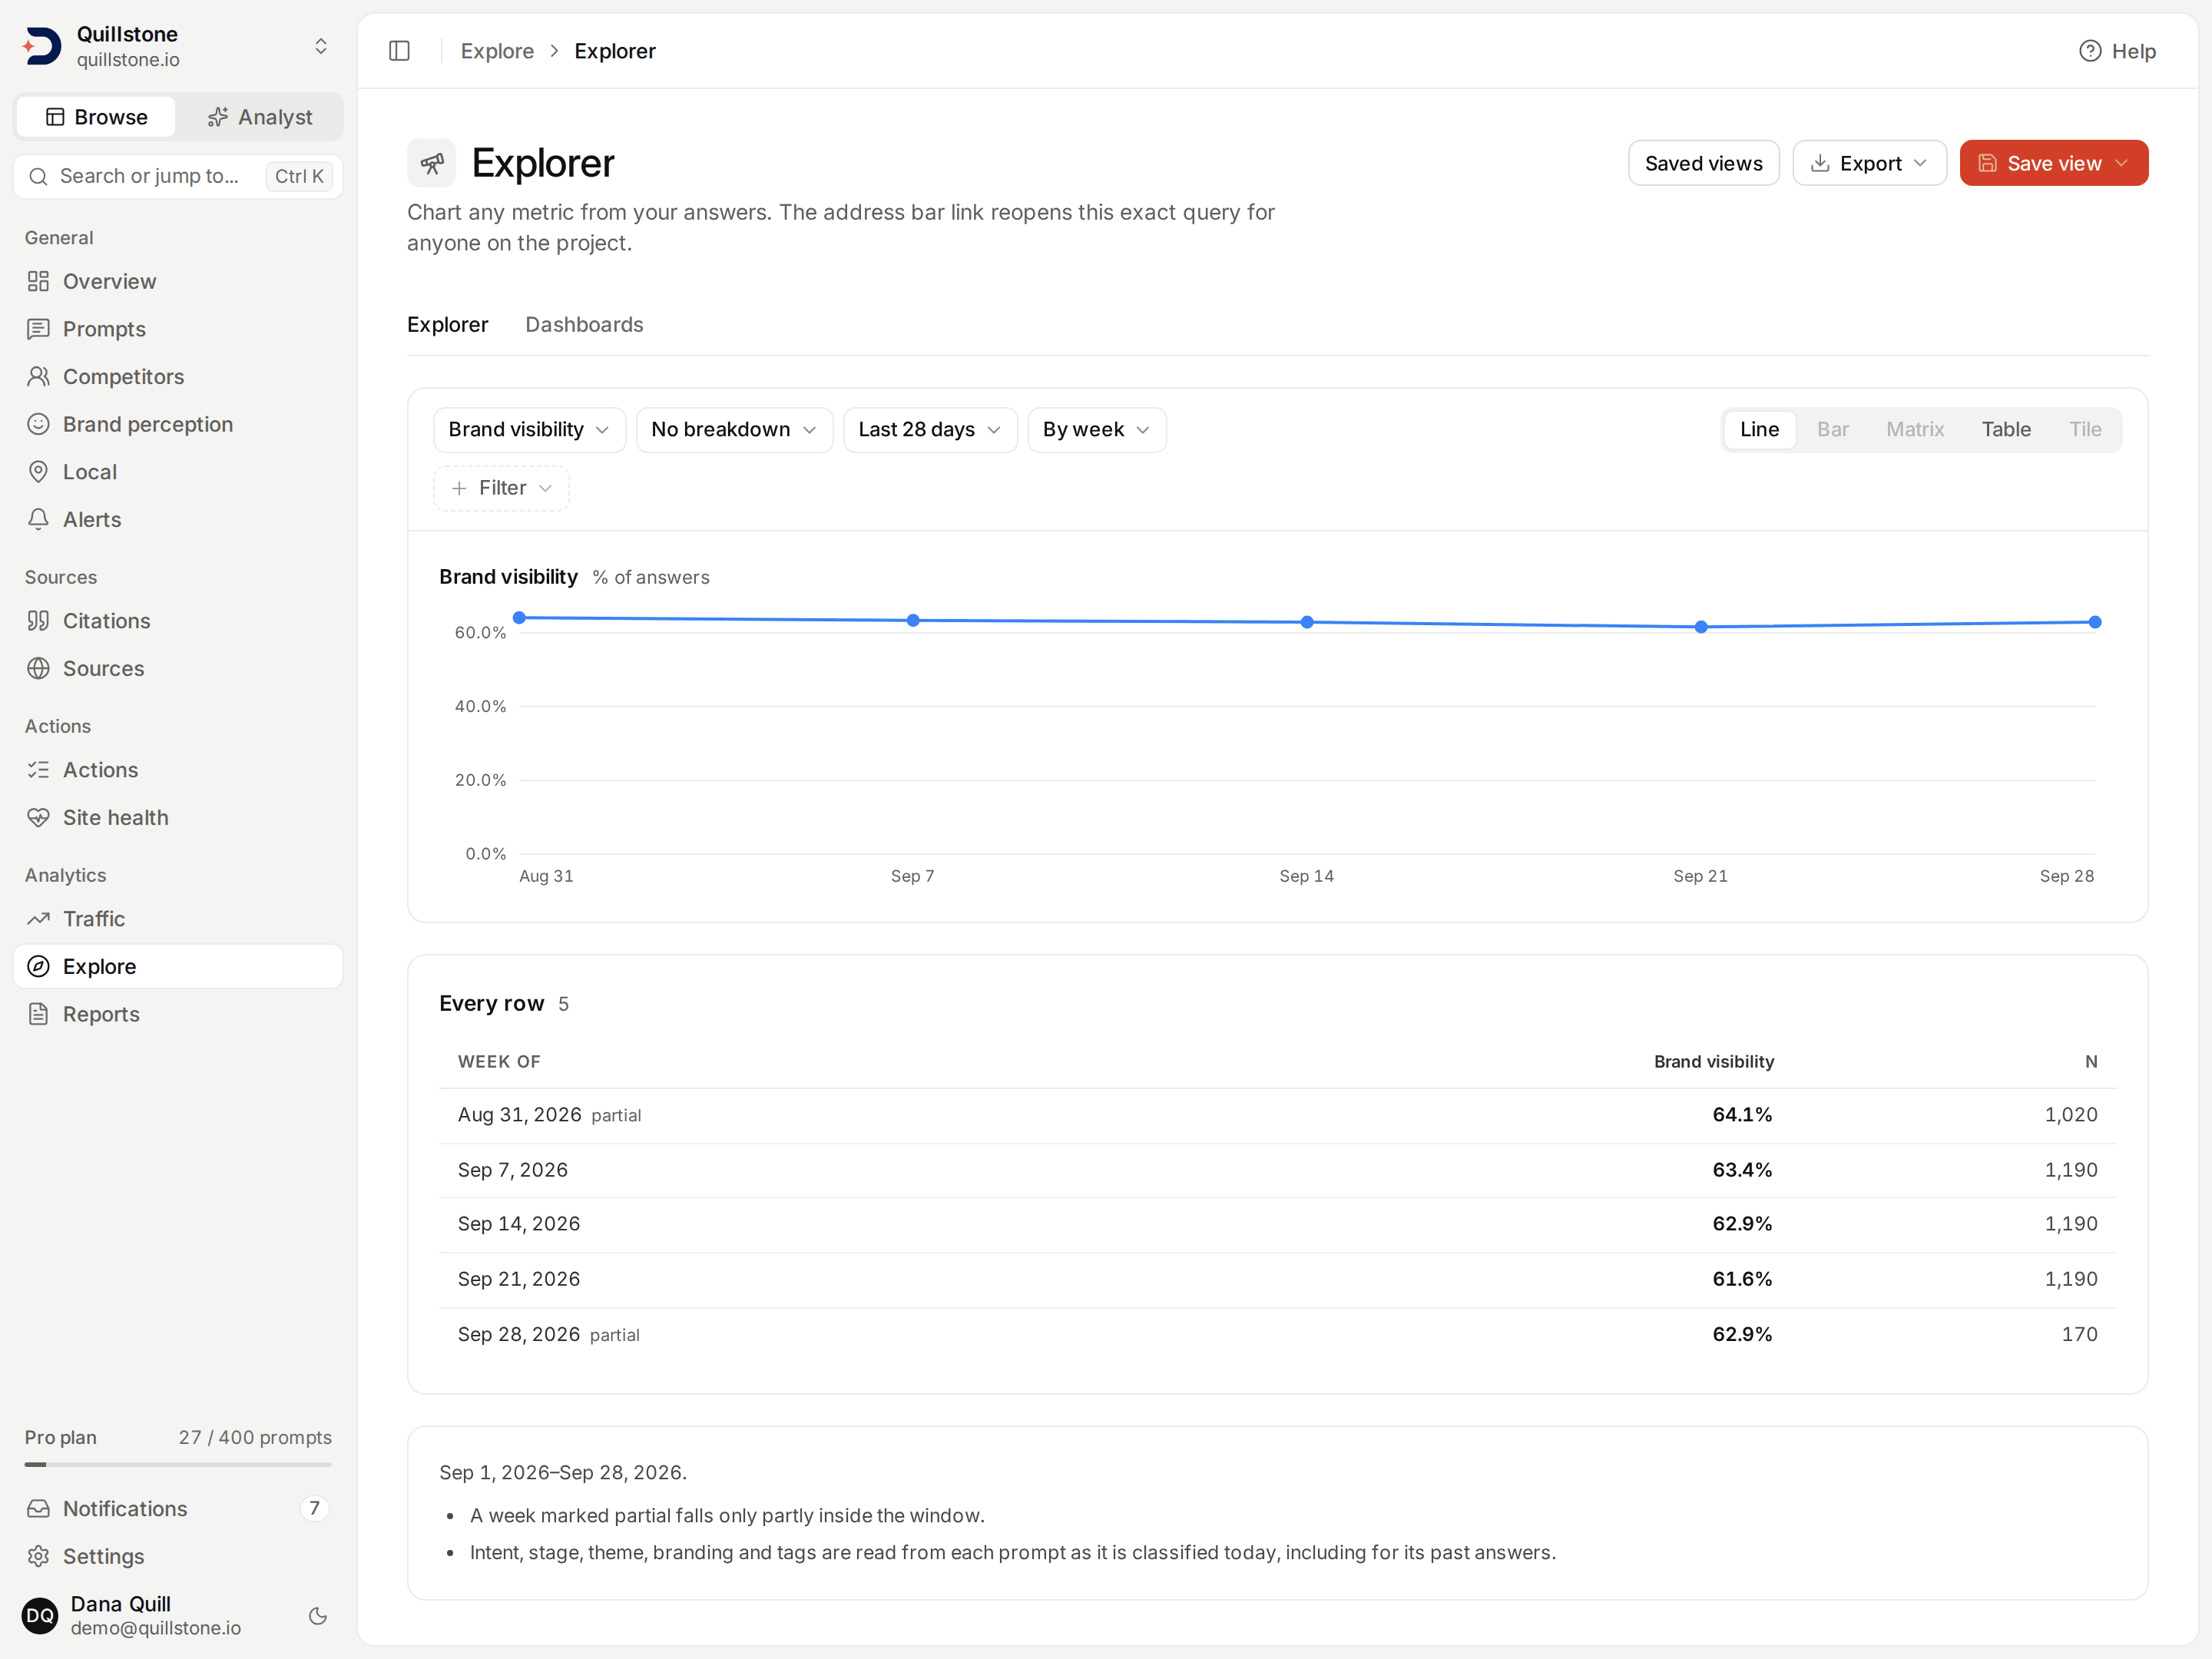
- Twenty-one metrics, fourteen ways to slice them: brand visibility, position, share of voice, citation rate, answers citing sources, retrieval coverage, sentiment, per-domain citation rate, answer counts, seven answer features and, for Google, the AI answer shown rate and organic rank, by engine, model, country, city, persona, language, prompt classification, tag or prompt, and by brand family or cited domain for the metrics they apply to. Up to five metrics, two breakdowns and eight filters in one query.
- Honest numbers: every metric on the Overview, from its headline visibility, share of voice, position, positive sentiment and citation rate to its brand ranking, trend chart and top sources, is an Explorer query, so it uses the same definitions as the Explorer; rates are pooled rather than averaged, missing data shows as no value instead of zero, and anything built on fewer than 30 observations is marked provisional. Line, bar, matrix, table or single-number tile, with the previous period or the same weekdays 52 weeks (364 days) earlier alongside.
- Saved views and dashboards: owners and editors save queries for the whole project and lay them out on dashboards; anyone on the project can read them. A view whose filters no longer match the project says exactly what needs repair instead of quietly showing something else.
- Take it with you: export a result as CSV or JSON with the project's data-export access (the file is the result as the Explorer computes it, including its limit of 25 values per breakdown), read it through the customer API or MCP on plans that include them, or, on plans with weekly-report access, share a saved view or dashboard as a snapshot link that expires after 1, 7 or 30 days and can be revoked. A shared snapshot is frozen when you create it; it never updates.
Tracking prompts in cities? Comparing a city's answers with its country's is part of AI visibility.
Dashboards
Keep the charts that matter on one page.
Save any Explorer query as a named view the whole project can open, lay views out on dashboards, and share a view or a dashboard with someone who has no account.
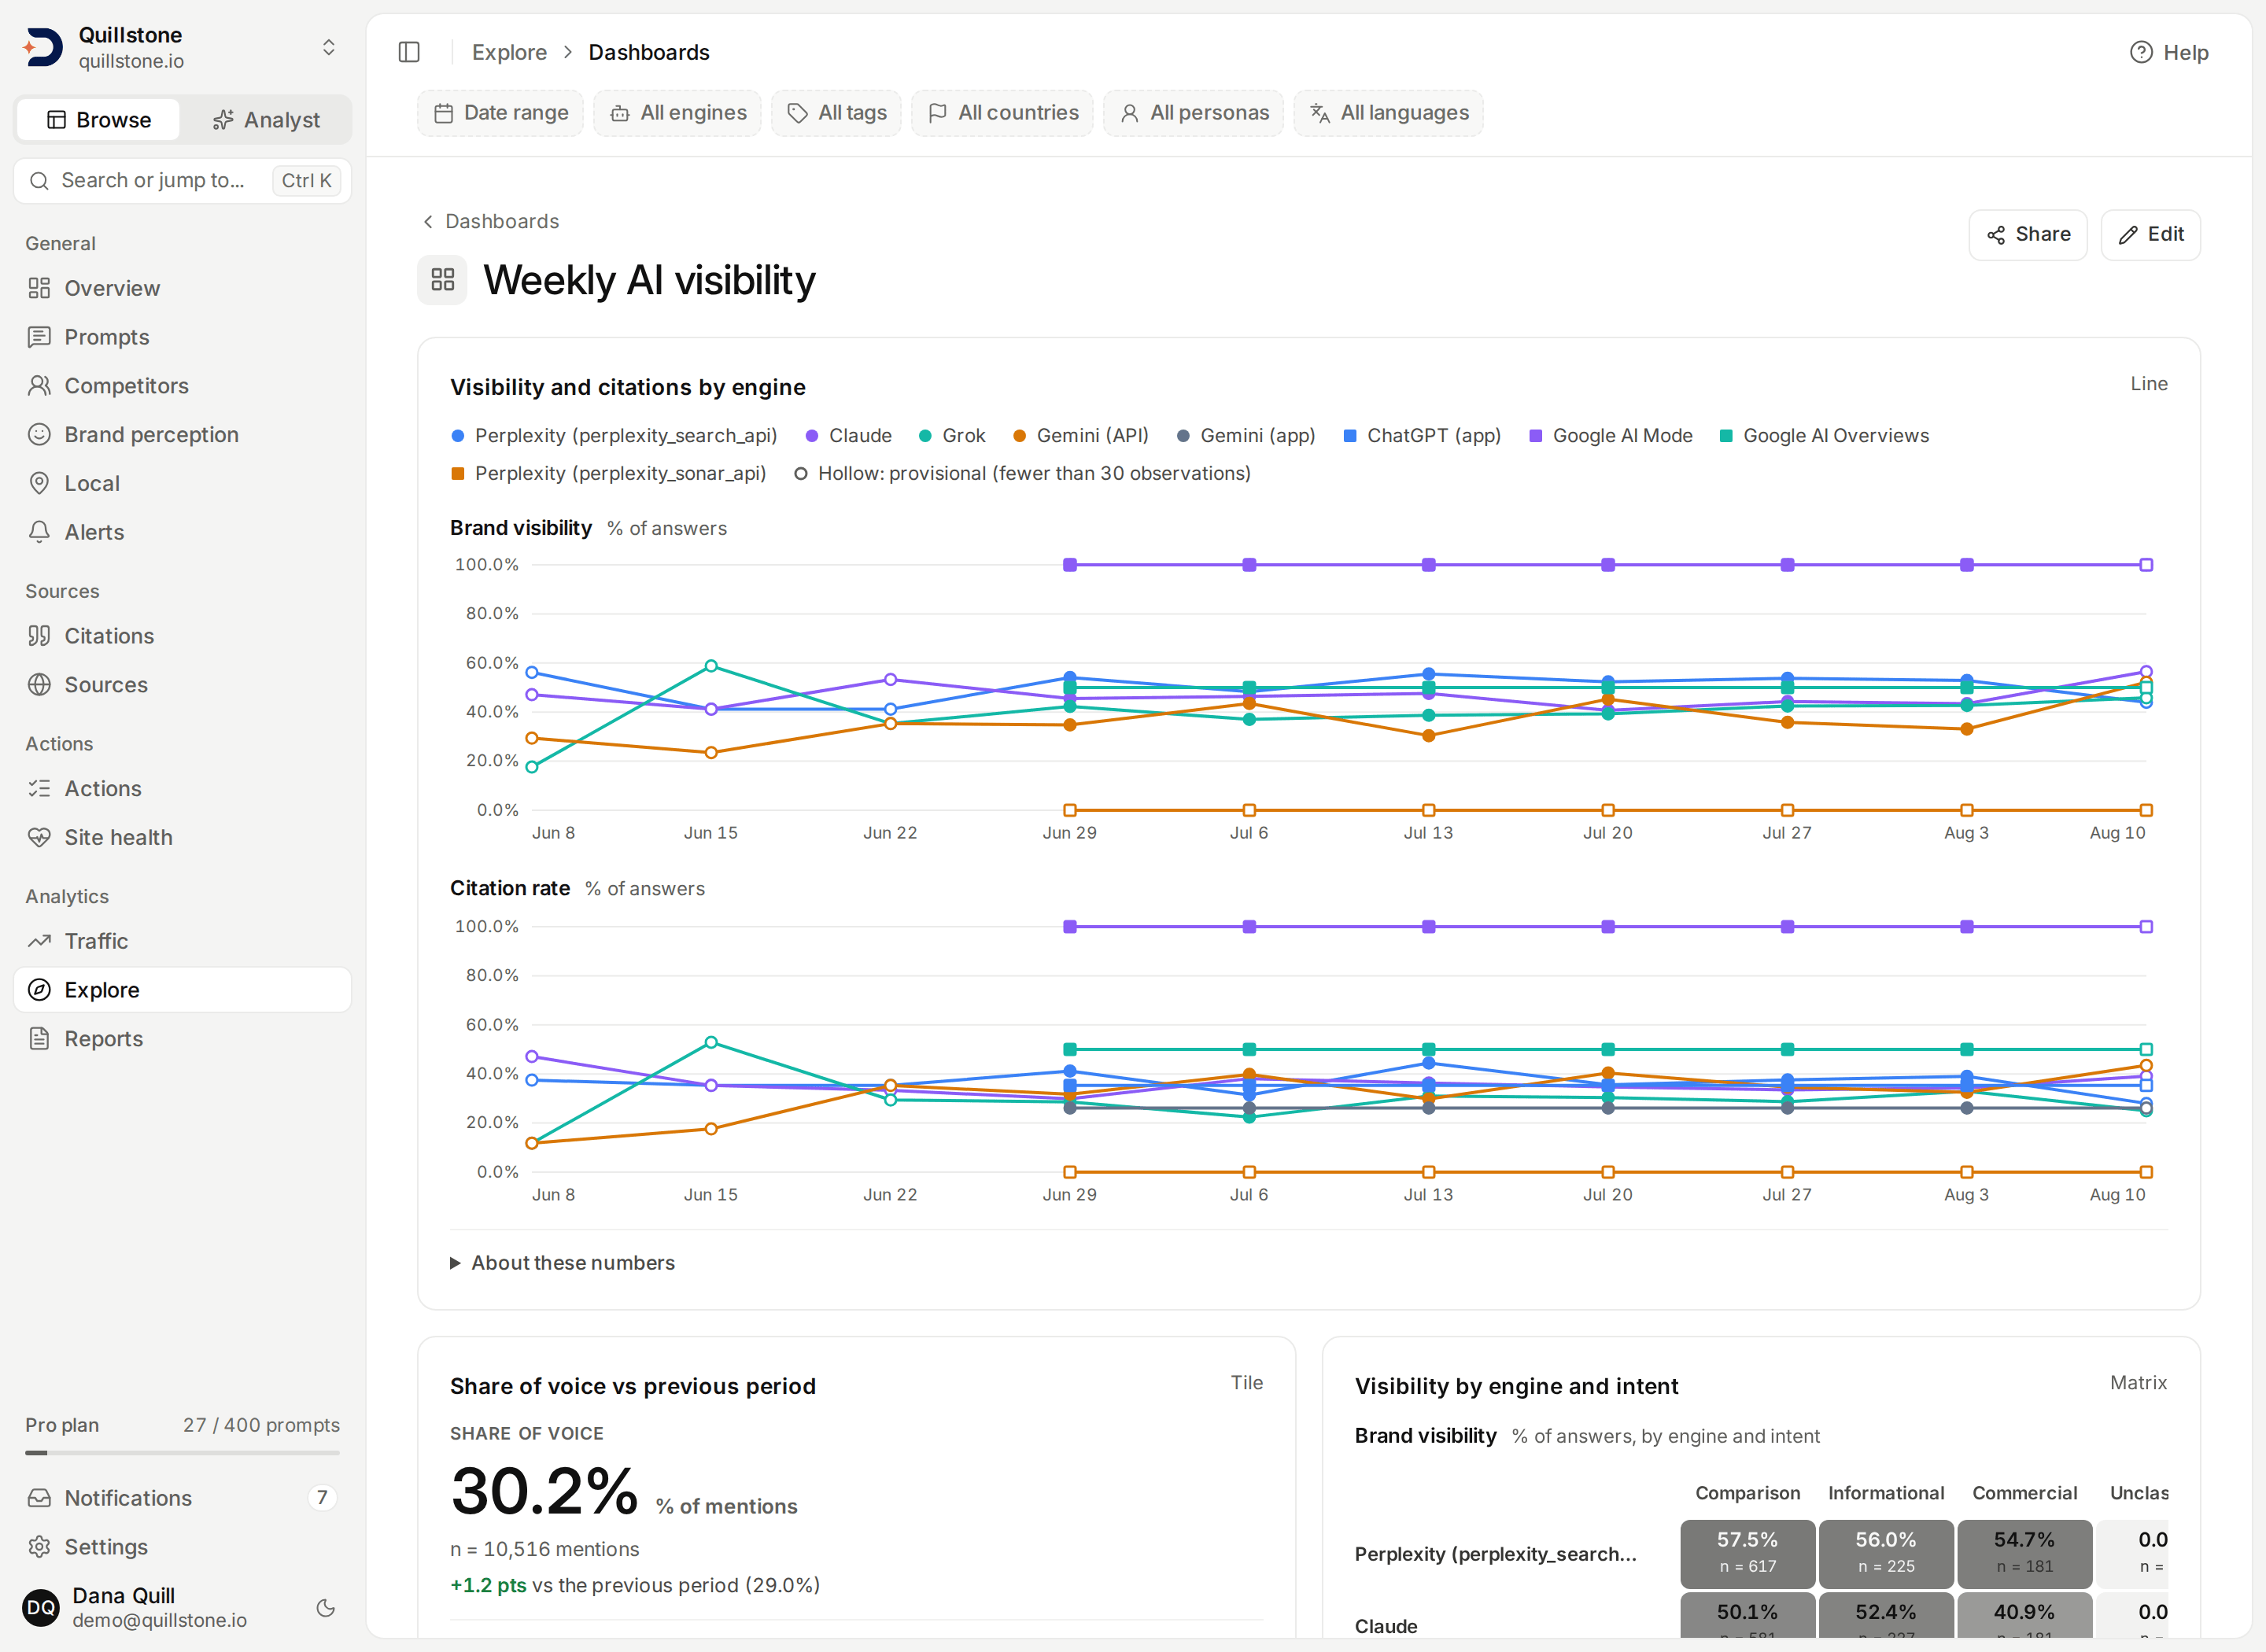
- Views that stay current: a view saved with a 7, 28 or 90 day window always shows the latest days; one saved with custom dates stays on them. Owners and editors save views and build dashboards; every member can read them.
- Room to organise: up to 100 saved views and 20 dashboards per project, each dashboard holding up to 12 views at half or full width. Two people editing the same view or dashboard cannot silently overwrite each other.
- Share a snapshot, not your project: a share link shows the results as they were when you made it, expires after 1, 7 or 30 days and can be revoked. It carries no internal ids, and every open checks the link again.
- Shown once, stored as a hash: the full link appears once, and only a hash of its secret is kept. Anyone holding the link can open and forward it, so treat it as private.
Saved views and dashboards come with the Explorer on every plan; share links follow the project owner's plan: Starter, Growth and Pro.
Analyst
Ask in plain words. Read the numbers it used.
Ask a question about your tracked AI answers, such as which engines mention you most and how that changed. Analyst plans up to four Explorer queries, runs them, and writes a short answer with the charts and tables underneath. Follow-ups build on the conversation, so "now only for ChatGPT (app)" changes the query you just saw.
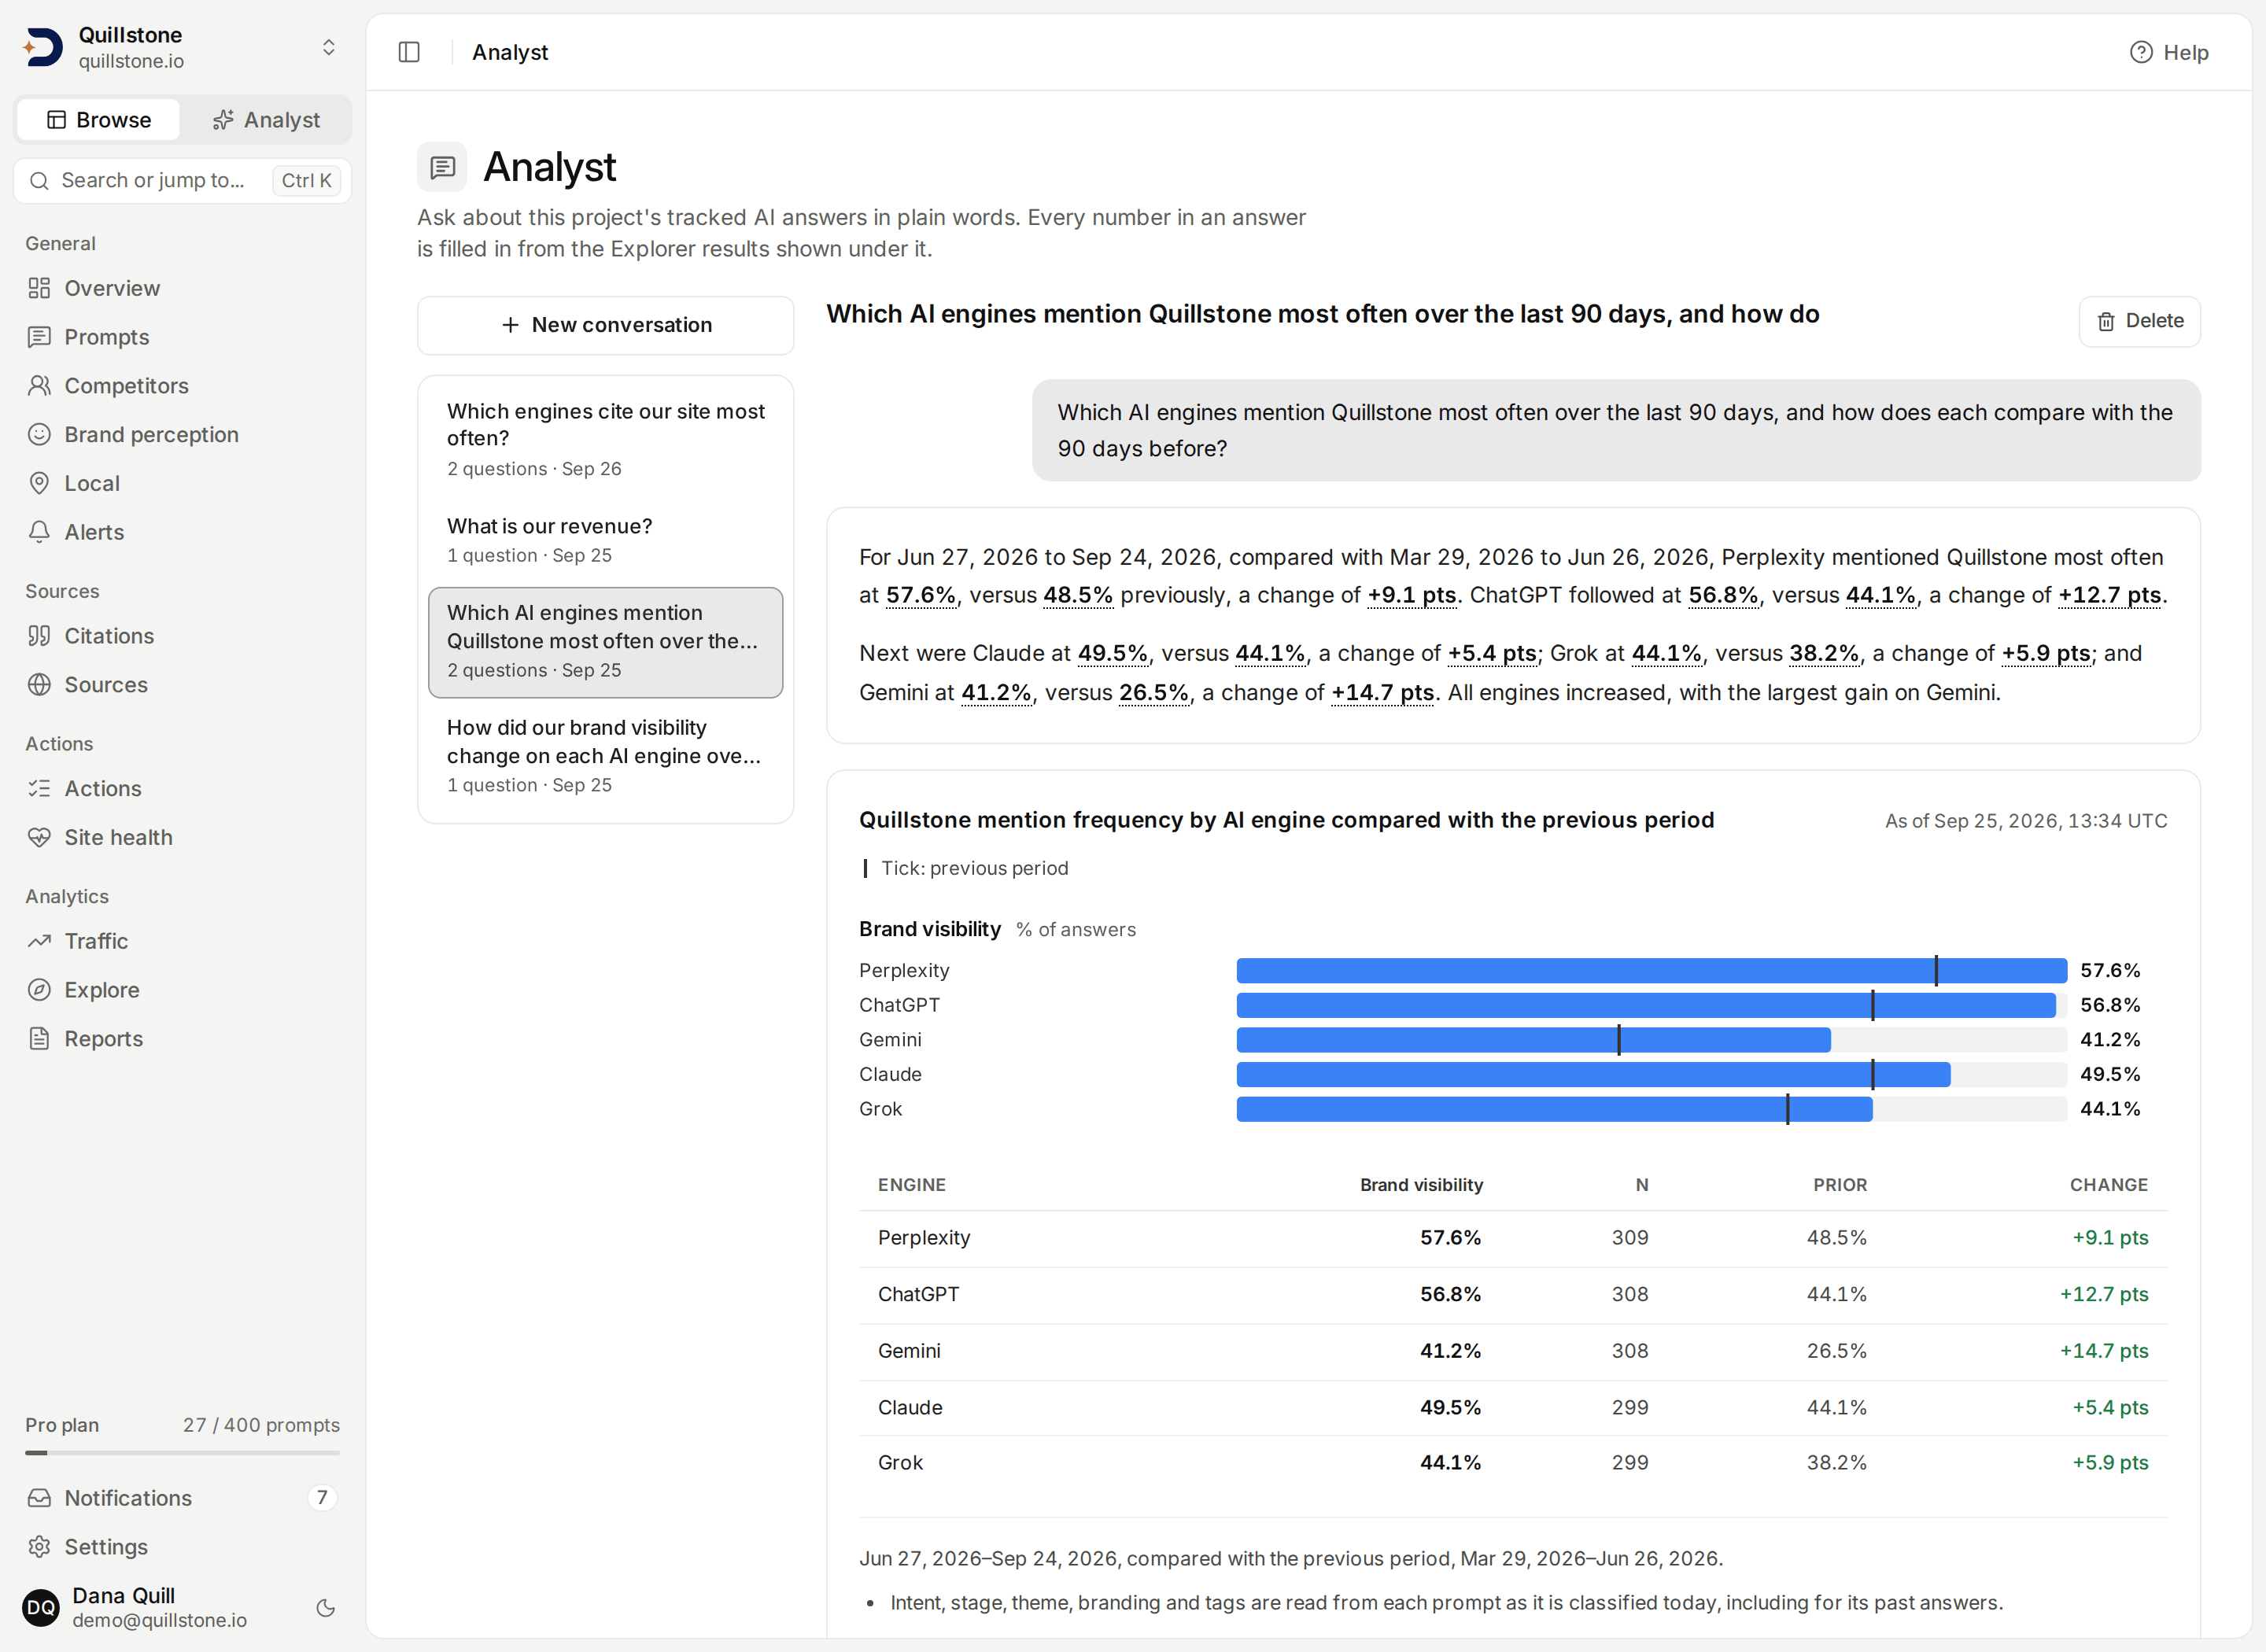
- No typed numbers. The model writes the words; every number and date range in the answer is filled in from the results shown under it, and so is a row name wherever the model uses a row placeholder. The model still chooses which row and metric each number comes from, so each number shows its row and metric and links to the table row it came from. The words around a number are not checked. An answer that types a number of its own gets one rewrite; if that fails too, you get the results without a summary. Missing data reads "no data", never zero.
- Read-only and private. Analyst answers from the Explorer's metrics only and cannot change anything. Conversations are private to the member who asked; to share a result, open it in the Explorer or, as an owner or editor, save it as a view.
Any project member, viewers included, on Starter, Growth and Pro.
Search and site traffic
Your Google search and site traffic, beside your AI visibility.
Connect Google Search Console and Google Analytics 4 and map a property to your project. Search shows how your pages perform in Google results; Site traffic reads all of your GA4 traffic, with the AI-referred share beside the total.
- Search, the way Google counts it: clicks, impressions, click-through rate and average position, with click-through rate taken from total clicks over total impressions and position weighted by impressions. Impressions split into four position bands: 1–3, 4–10, 11–20 and 21+.
- Near misses and movers: quick wins lists queries at an average position from 4 to 20 with at least 10 impressions, and movers lists the queries that gained or lost clicks against the window before.
- AI counted first: every session falls into exactly one of seven channels (AI, Organic, Direct, Referral, Social, Paid and Other), and AI is checked first, so an AI referral is never split across the others.
- Pages that underconvert: pages with at least 10 sessions whose conversion rate sits below the site average, or that recorded no conversion at all. Conversions use GA4's own figures, replaced by the conversion events you name (or GA4's purchase and sign_up events when you name none) on the rows where they fired.
- Against the period before: both screens cover the last 7, 28 or 90 days and compare each change with the window immediately before it.
AI traffic
See whether a citation turned into a visit.
A citation measures the answer, not what the reader did next. AI Traffic reads your Google Analytics 4 property for the sessions that arrived from an AI engine's own referrer, so you can see whether a citation became a visit, and whether that visit converted.
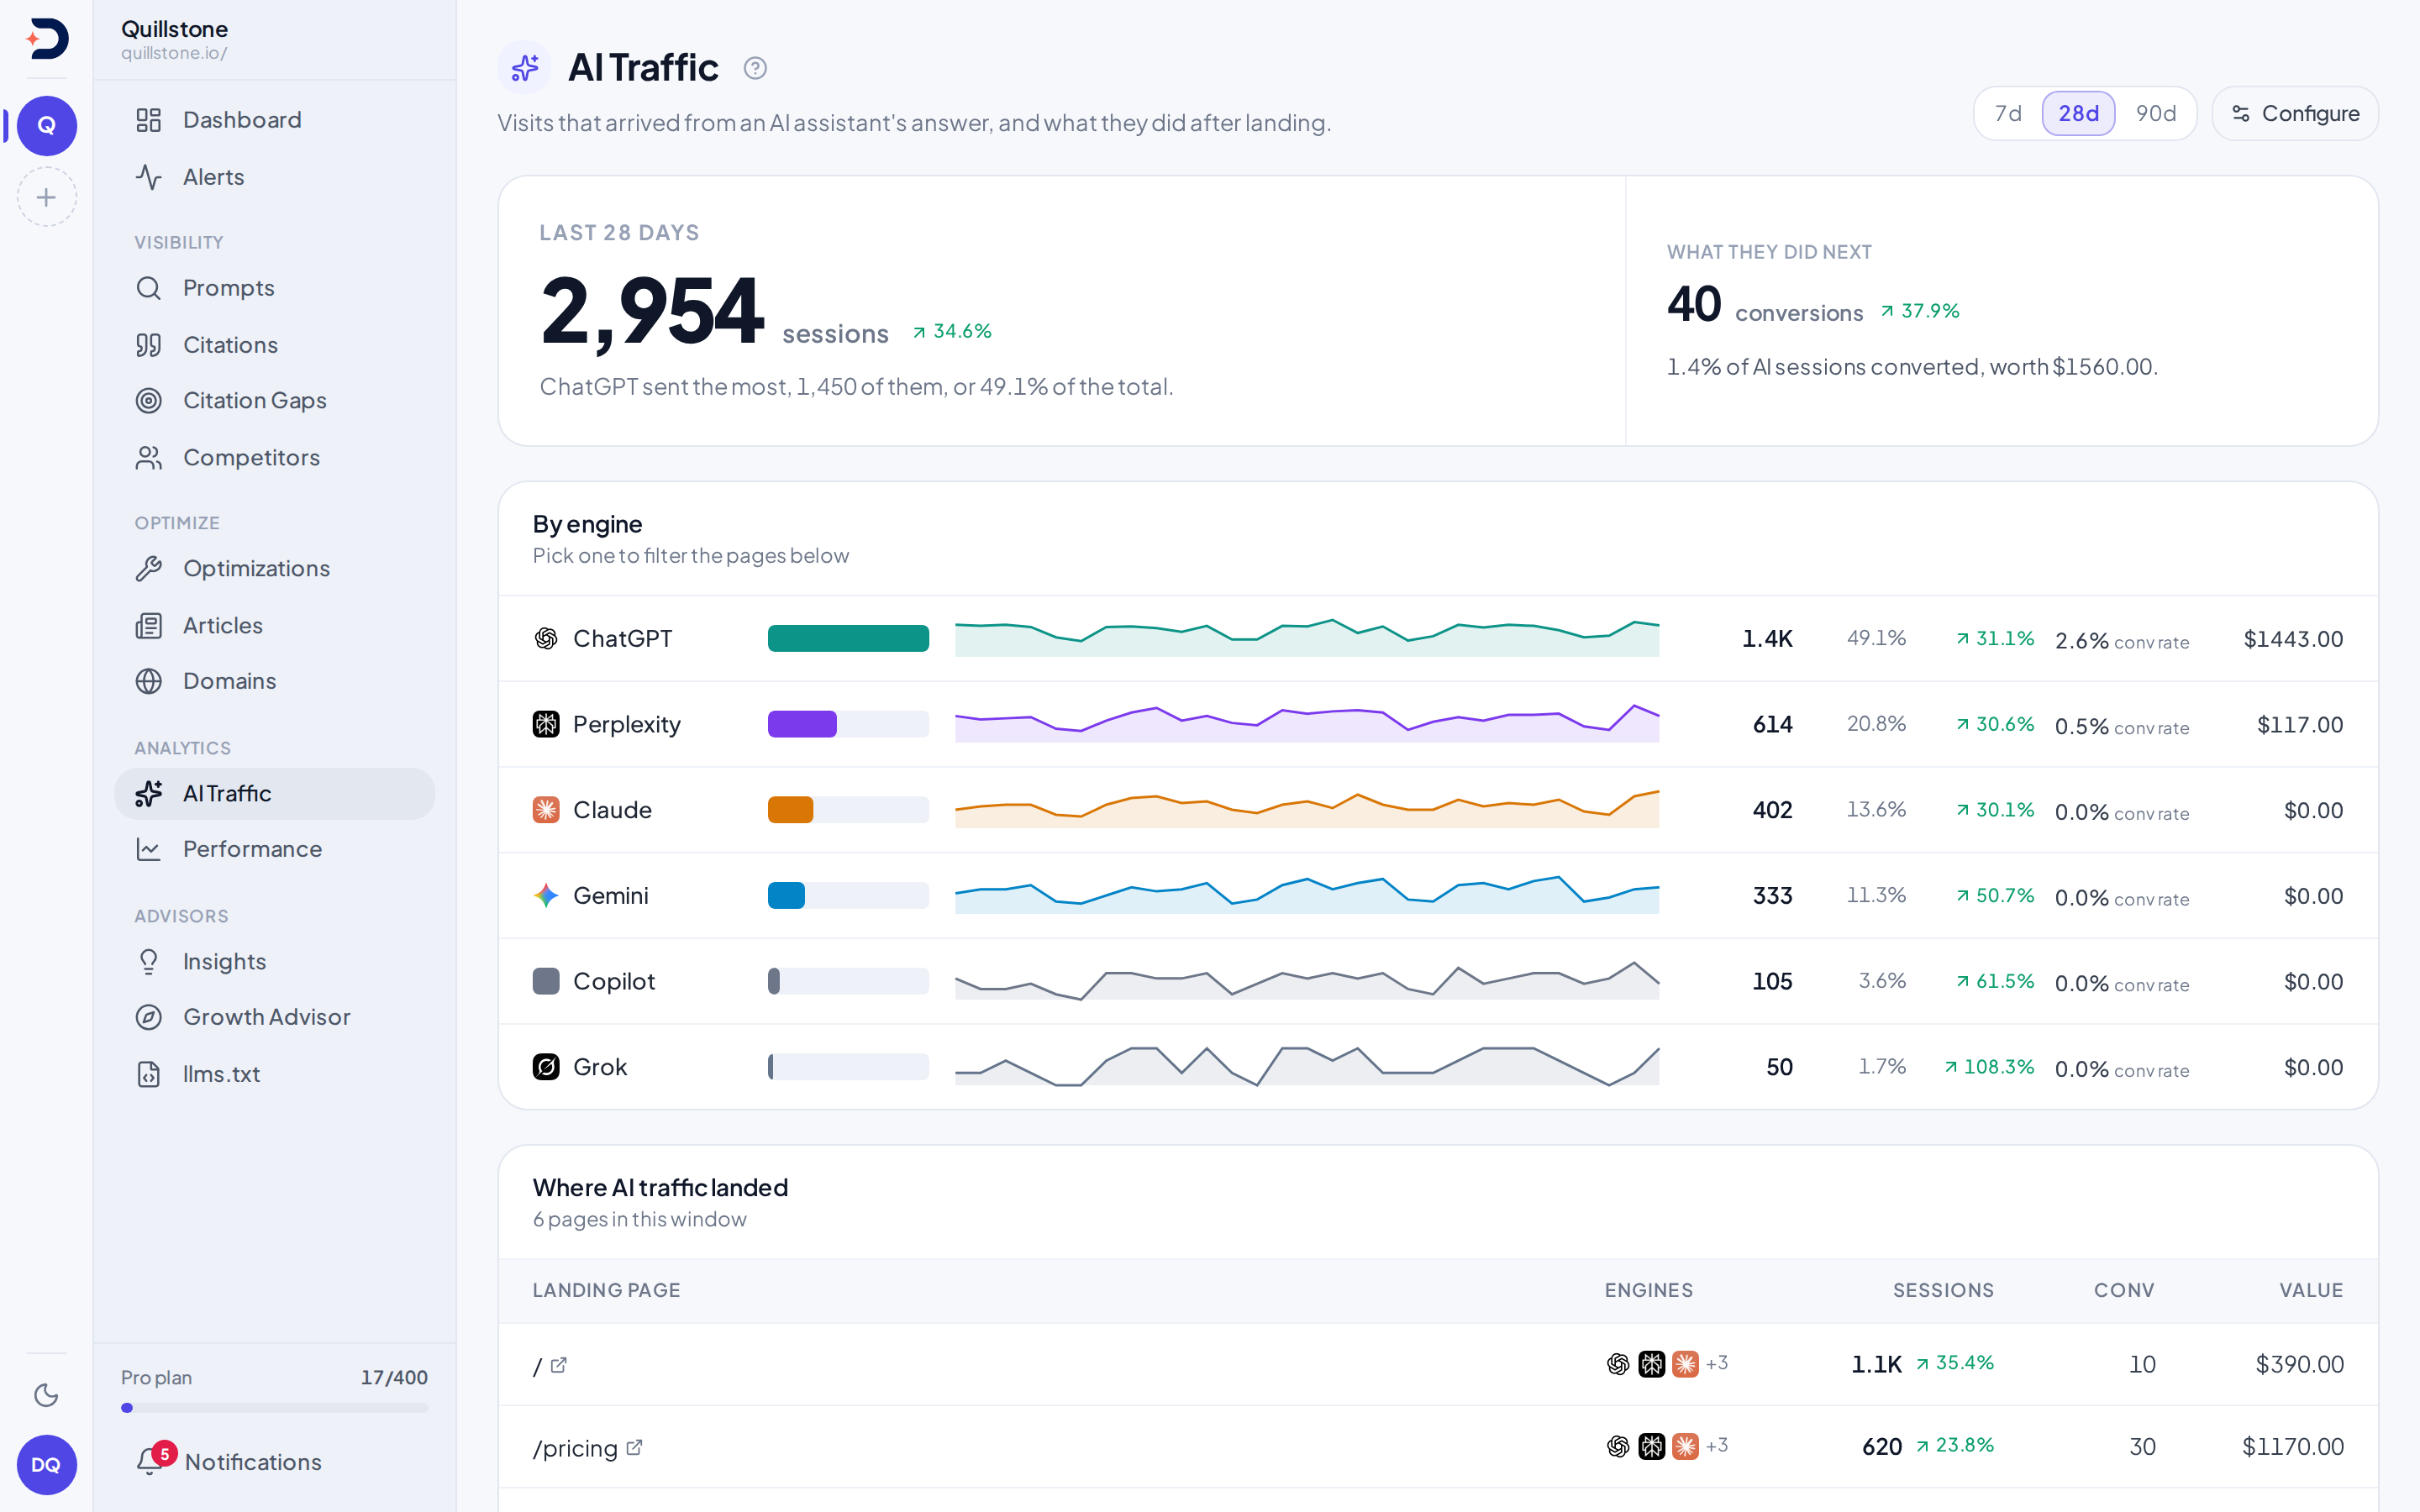
- Ten AI referrers: 21 known referrer hosts resolve to ChatGPT, Claude, Gemini, Grok, Perplexity, Copilot, You.com, Phind, Kagi and Metaphor, whether or not DiscoveredBy tracks answers on that engine.
- Sessions, conversions and landing pages: sessions by engine with each one's share and change, then the top 50 landing pages by sessions with the engines that sent them. Select a referrer to switch the headline figures and landing pages to its visits.
- No change measured from zero: an engine sending traffic for the first time shows no change rather than a percentage measured from nothing.
- What it cannot see: Google AI Overviews and AI Mode have no referrer of their own. Their visits reach GA4 as ordinary Google search traffic, so they cannot appear here.
AI crawlers
See which AI bots actually read your site.
Robots.txt says what you allow. Your server logs say what happened. Send them to DiscoveredBy and see which AI crawlers requested which pages, whether each request really came from the bot's operator, what your site served it, and which of those pages AI answers cite.
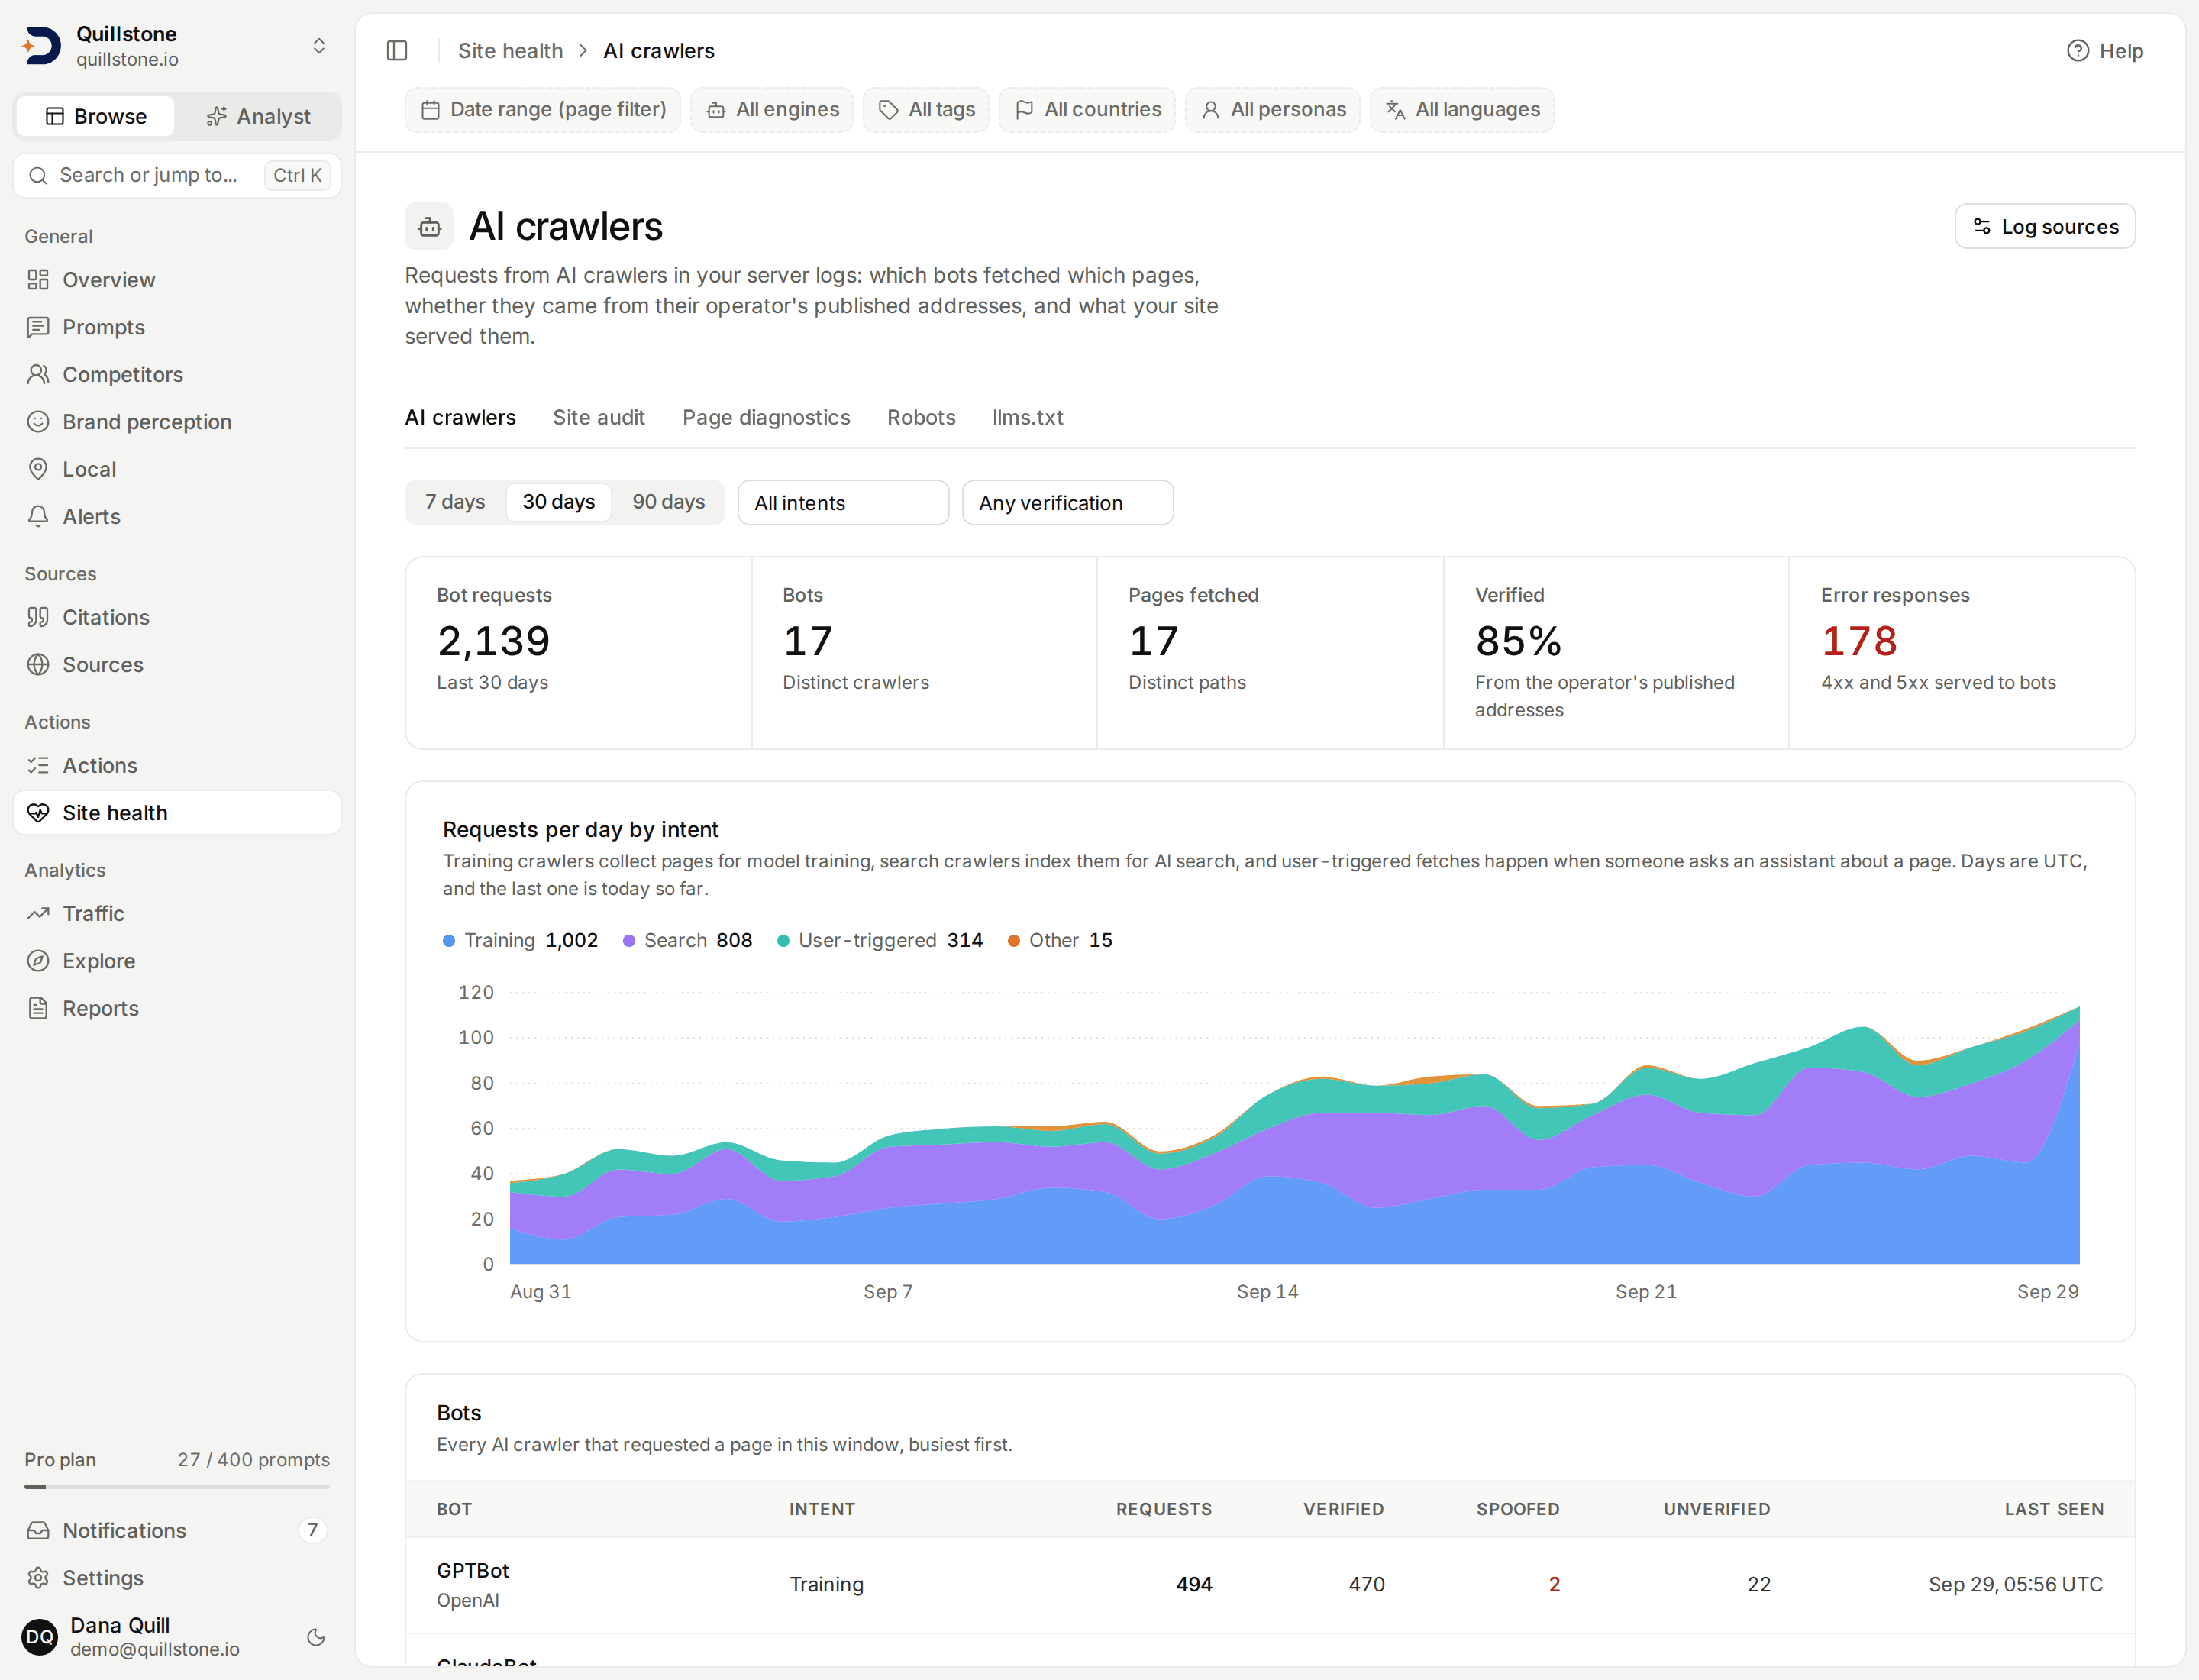
- Four ways in: post log lines to a webhook from any log shipper, paste a Cloudflare Worker script, point a Cloudflare Logpush job at the same endpoint, or upload an access log in the browser.
- Genuine or spoofed: Bots from OpenAI, Anthropic, Google, Perplexity, Microsoft, Apple, Meta, Amazon and others are recognised by user agent, and each request is checked against the address ranges its operator publishes. A request from outside them is marked spoofed; one that cannot be checked, including every request from a bot we hold no published ranges for, is marked unverified.
- Pages bots cannot use: requests per day by training, search, user-triggered and other intent, the pages bots fetch most, and the pages whose latest response to a bot was an error. A page cited in your AI answers in the same window is marked Cited.
- Only bots are kept: a line whose user agent names no known bot is counted and discarded, and client IP addresses are used for the check and never stored. Individual requests are kept 30 days and daily totals 400 days.
Follows the project owner's plan: Starter, Growth and Pro, each with a monthly number of stored bot requests per project shown on Pricing.
Take It With You
Your data, in your own tools.
Give clients a clear weekly digest with their project name and brand colour. Owners and editors with weekly-report access can preview a fixed snapshot, share it through an expiring link without client sign-in, inspect issued snapshots later, and revoke access when needed. Save reusable project report templates with selectable sections and a default. Optionally include up to five saved citation examples from the report’s week, with source URLs, saved snippets and collection details. Explore client report links. Review the same saved week across accessible projects in the Client reports overview, then preview and share a combined report for 2–10 clients. Each client keeps separate metrics and its default report sections. Access is rechecked for every included project.
Invite teammates with a seven-day, email-bound link. They sign in and accept the project role before access starts. Owners manage pending links; available seats are checked at acceptance. Explore team invitations.
Connect your own reporting scripts with the read-only customer API, included on Starter, Growth and Pro. Create expiring, revocable keys for one client project and selected reads: prompts, answers, citations, metrics, reports, brand reasons, objections, attributes and fact checks. Paginate collected answers and saved citation URLs, positions and snippets. Retrieve complete saved answer text with collection provenance preserved. Each key allows 60 authenticated requests per minute. Read saved weekly digests with four stored metrics, summary, activity and recommendation titles when the project has weekly-report access. Daily metrics include collection counts, brand visibility and own-domain citation rate with denominators and collection provenance. Connect a compatible assistant through the read-only MCP connector using the same project key and permissions. Streamable HTTP clients must support a custom Authorization header. A key with the opt-in Explorer permission can also run Explorer queries and saved views. A refreshable BI connector remains outside this release.
Not every stakeholder lives in a dashboard. DiscoveredBy lets you download your project's data as CSV or JSON, ready to drop into a BI tool, a board deck, or a report you're building yourself, so you're never limited to the screens we built for you.
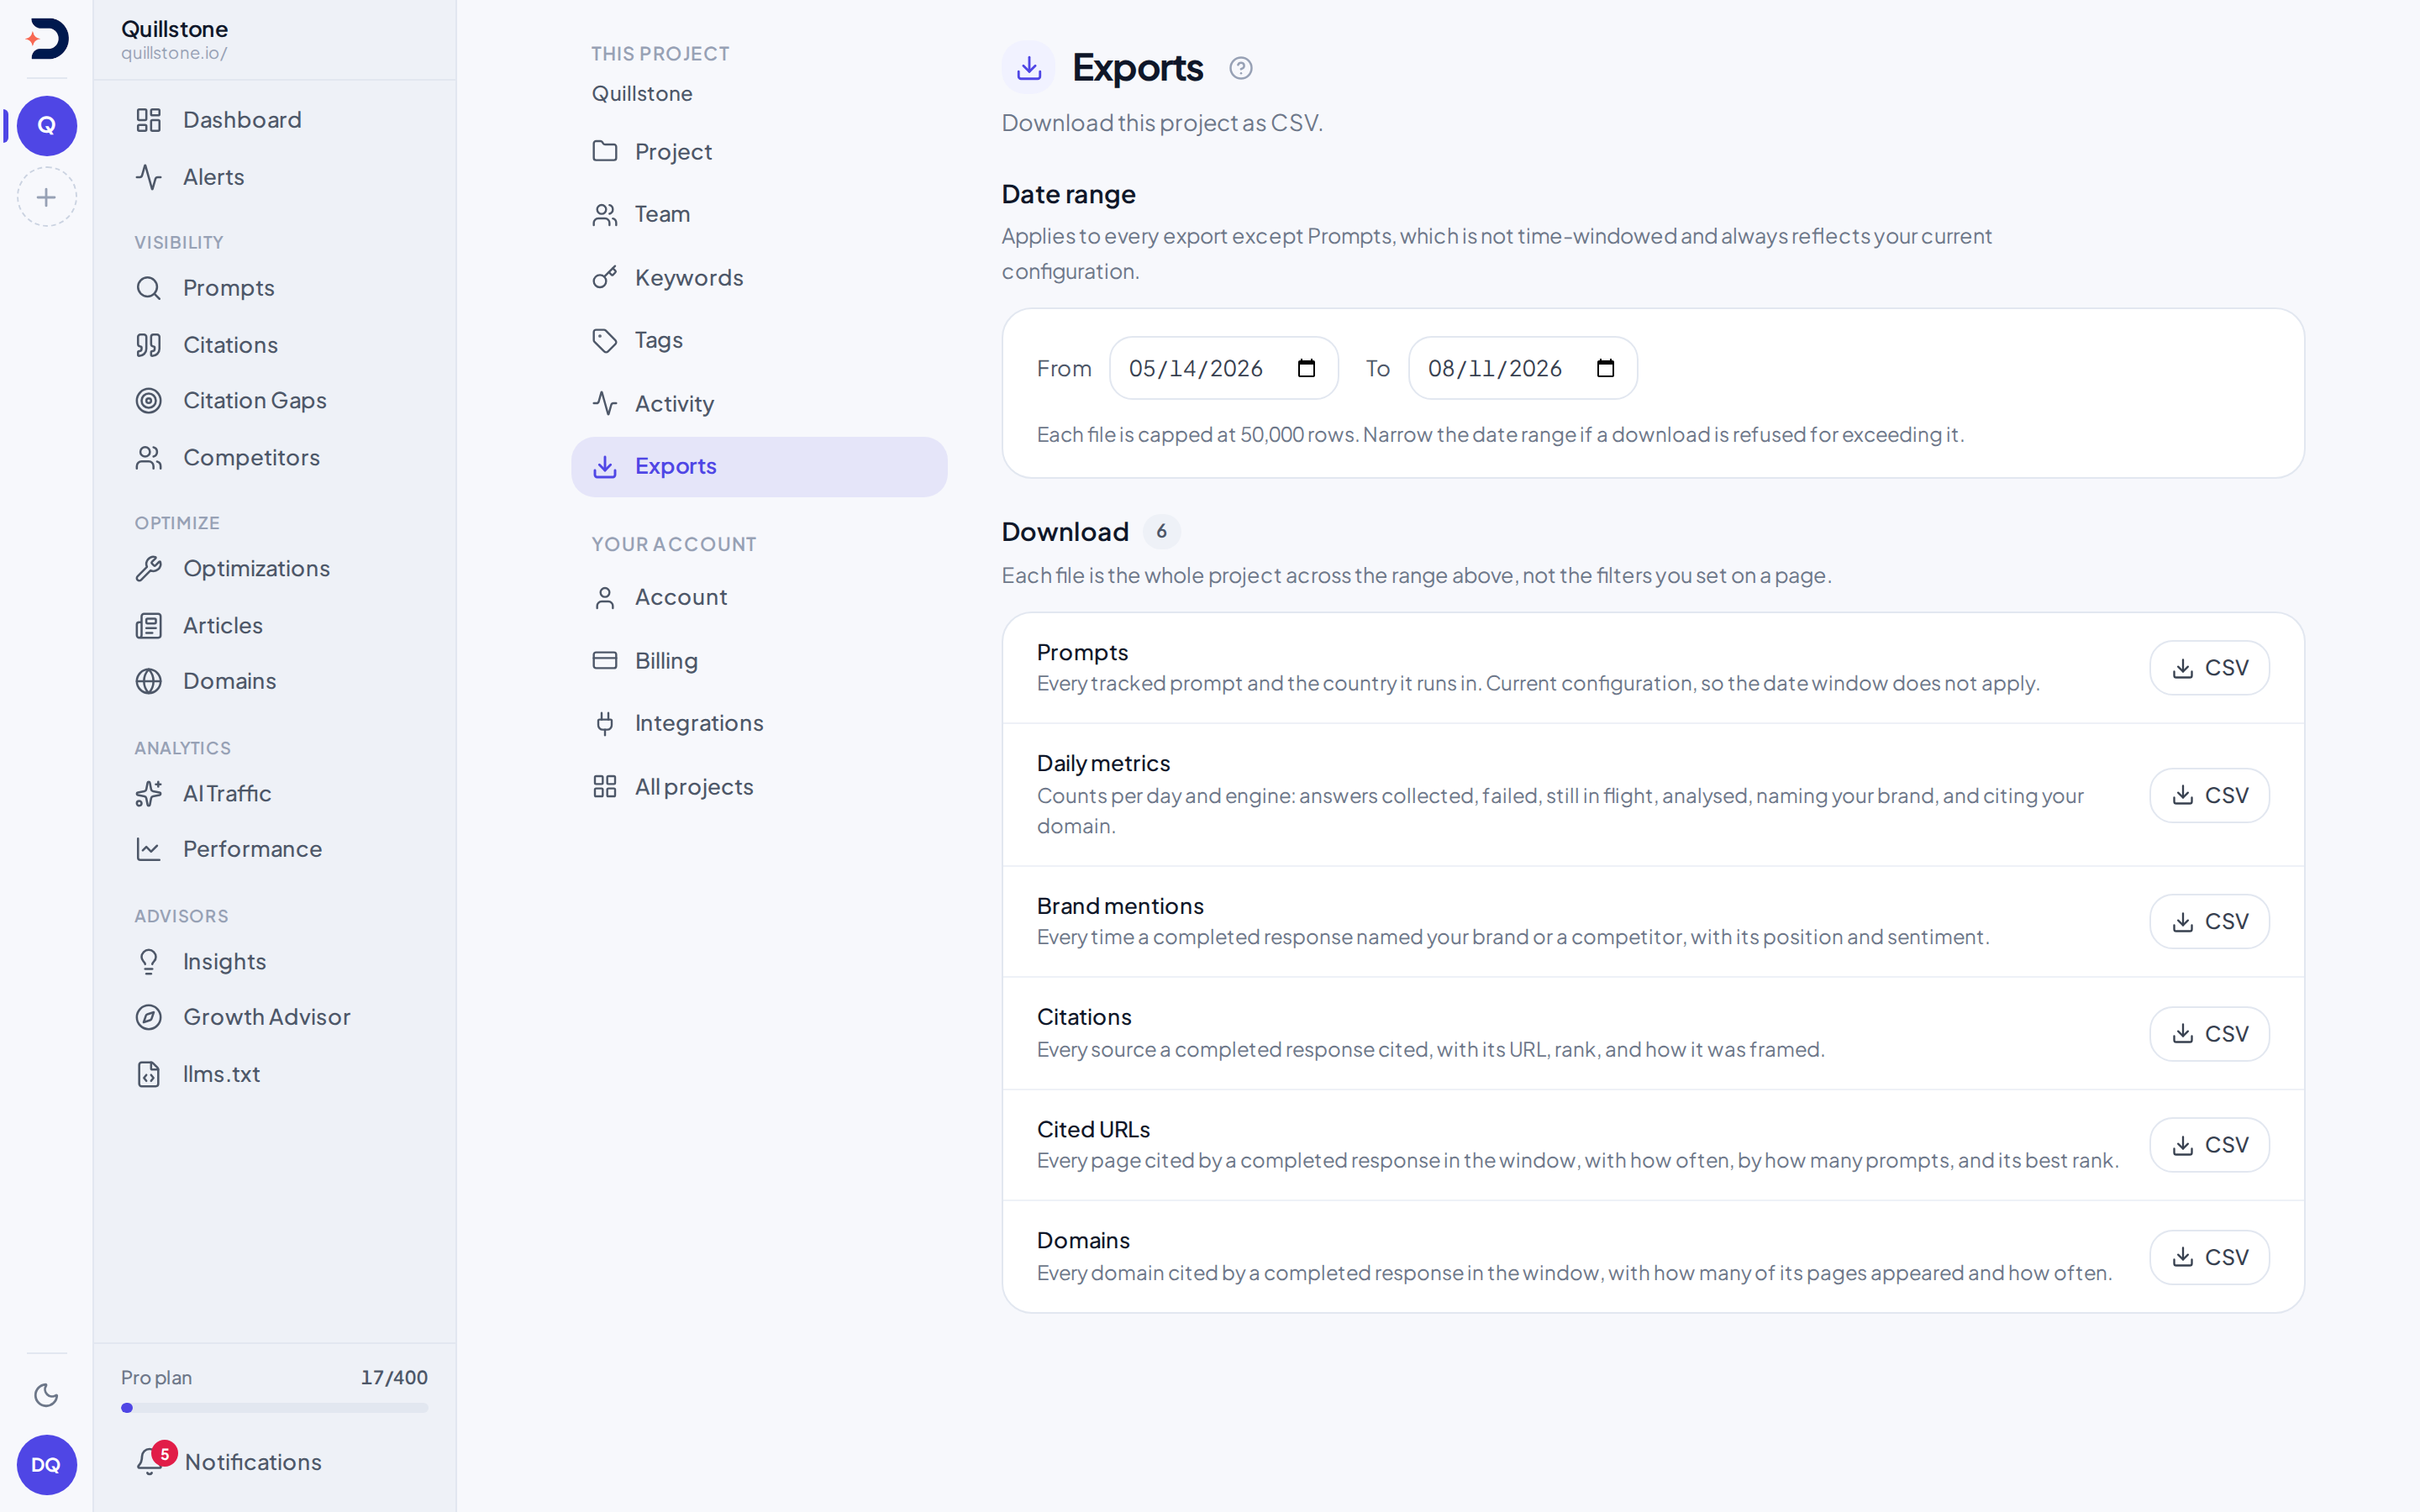
- Thirteen ready-made datasets: prompts, daily metrics, brand mentions, brand reasons, objections, attributes, fact checks, citations, cited URLs, domains, Google organic results, answer features, and the answers themselves, each one download away.
- Two formats, one set of numbers: CSV for a spreadsheet, JSON for a script or a BI tool. Both come from the same query, so they carry the same rows in the same order.
- Built for the whole team: any member of a project, not only its owner, can pull the exports they need.
- Nothing is cut behind your back: a request too large to return safely is refused outright with a clear message rather than trimmed to fit. The one thing that is shortened, a very long response in the Answers file, says so in its own row and reports its true length.
Documentation
Learn more in the docs
Explorer
Build your own chart from twenty-one metrics, including the Google shown rate, organic rank, answers citing sources and answer features, fourteen breakdowns and filters, a window, a comparison and smoothing, with the population rules and limits behind every number.
Read the docsDashboards and sharing
Save Explorer queries as views, lay them out on dashboards, export a result, and share a frozen, expiring snapshot by link.
Read the docsAnalyst
Ask a question about your tracked AI answers in plain words and get a short answer built from Explorer queries, with every number filled in from the results shown under it.
Read the docsSearch performance
Google Search Console data for your site: what you rank for, which positions moved, and where a small change would pay.
Read the docsTraffic
Google Analytics sessions grouped by where they came from, with AI counted first, and the pages where attention is not converting.
Read the docsAI traffic
Sessions that arrived from an AI engine, split by engine, with the pages they landed on and what they did next.
Read the docsAI crawlers
Which AI crawlers request your pages, whether each request came from its operator, what your site served it, and which fetched pages AI answers cite, read from logs you send.
Read the docsExports and activity
Every downloadable dataset, what one row means in each, how CSV and JSON differ, the per-dataset row cap that refuses rather than truncates, and what the project activity log can actually show.
Read the docs
Ready to see your AI visibility?
Start monitoring how AI search engines talk about your brand.
Start free