Analytics
AI traffic
Sessions that arrived from an AI engine, split by engine, with the pages they landed on and what they did next.
What this is for
Citations record that an AI engine named your
domain as a source for an answer. That measures the answer, not what the
reader who saw it actually did. AI Traffic
reads your Google Analytics 4 property for the sessions that arrived from an
AI engine's own referrer, so you can see whether a citation turned into a
visit, and whether that visit converted
(api/routers/integrations.py#ai_traffic_summary). It is the outcome side of
the same loop
Google rankings versus AI citations
opens on the input side: citations measure whether engines pull you in, AI
Traffic measures whether the people they send you do anything once they land.
What counts as AI traffic
Every session GA4 logs carries a source, not always a referring host: it
reads (direct) when there is none
(api/services/integrations/google/ga4_attribution.py#_upsert_metrics).
AI Traffic keeps only the sessions whose source matches one of 21 known AI
referrer hosts, case-insensitively and regardless of scheme
(https://chatgpt.com and chatgpt.com match the same way), each resolving
to one of ten canonical engines: chatgpt.com, chat.openai.com and
openai.com all resolve to ChatGPT; grok.com, x.ai and grok.x.ai all resolve
to Grok; every other engine carries one to three hosts of its own
(api/services/integrations/google/ga4_referrers.py#classify_referrer,
#_AI_ENGINE_HOSTS). A session whose source is not on that list, including
one with no referrer at all, is not counted here, whatever channel it
actually came from. That classification is the only place in the product
that decides whether a session is AI-referred; nothing else here duplicates
it with a second definition.
Five of those ten referrers, ChatGPT, Claude, Gemini, Grok, and Perplexity,
belong to engines the rest of the product runs prompts against, and they
carry their usual logo here too. The ChatGPT referrer is named plain
"ChatGPT": it counts people who arrived from ChatGPT itself (the three
OpenAI hosts above), and the product's ChatGPT engine, ChatGPT (app),
maps to it. The Gemini referrer is named plain "Gemini" in
the same way: it counts people who arrived from Gemini's own hosts
(gemini.google.com and bard.google.com), and both Gemini engines, Gemini
(API) and Gemini (app), map to it. Google AI Overviews and Google AI Mode
have no referrer of their own: a visit from either reaches GA4 as
ordinary Google search traffic, which cannot be told
apart from any other Google click, so neither appears here
(api/services/integrations/google/ga4_referrers.py#REFERRER_BY_ENGINE). The other five, Copilot, You.com, Phind,
Kagi, and Metaphor, are not engines DiscoveredBy queries directly, but GA4
still reports sessions from them, so they appear here with a title-cased name
and a plain colour instead of a logo
(frontend/src/lib/provider-meta.js#PROVIDER_META).
What you see
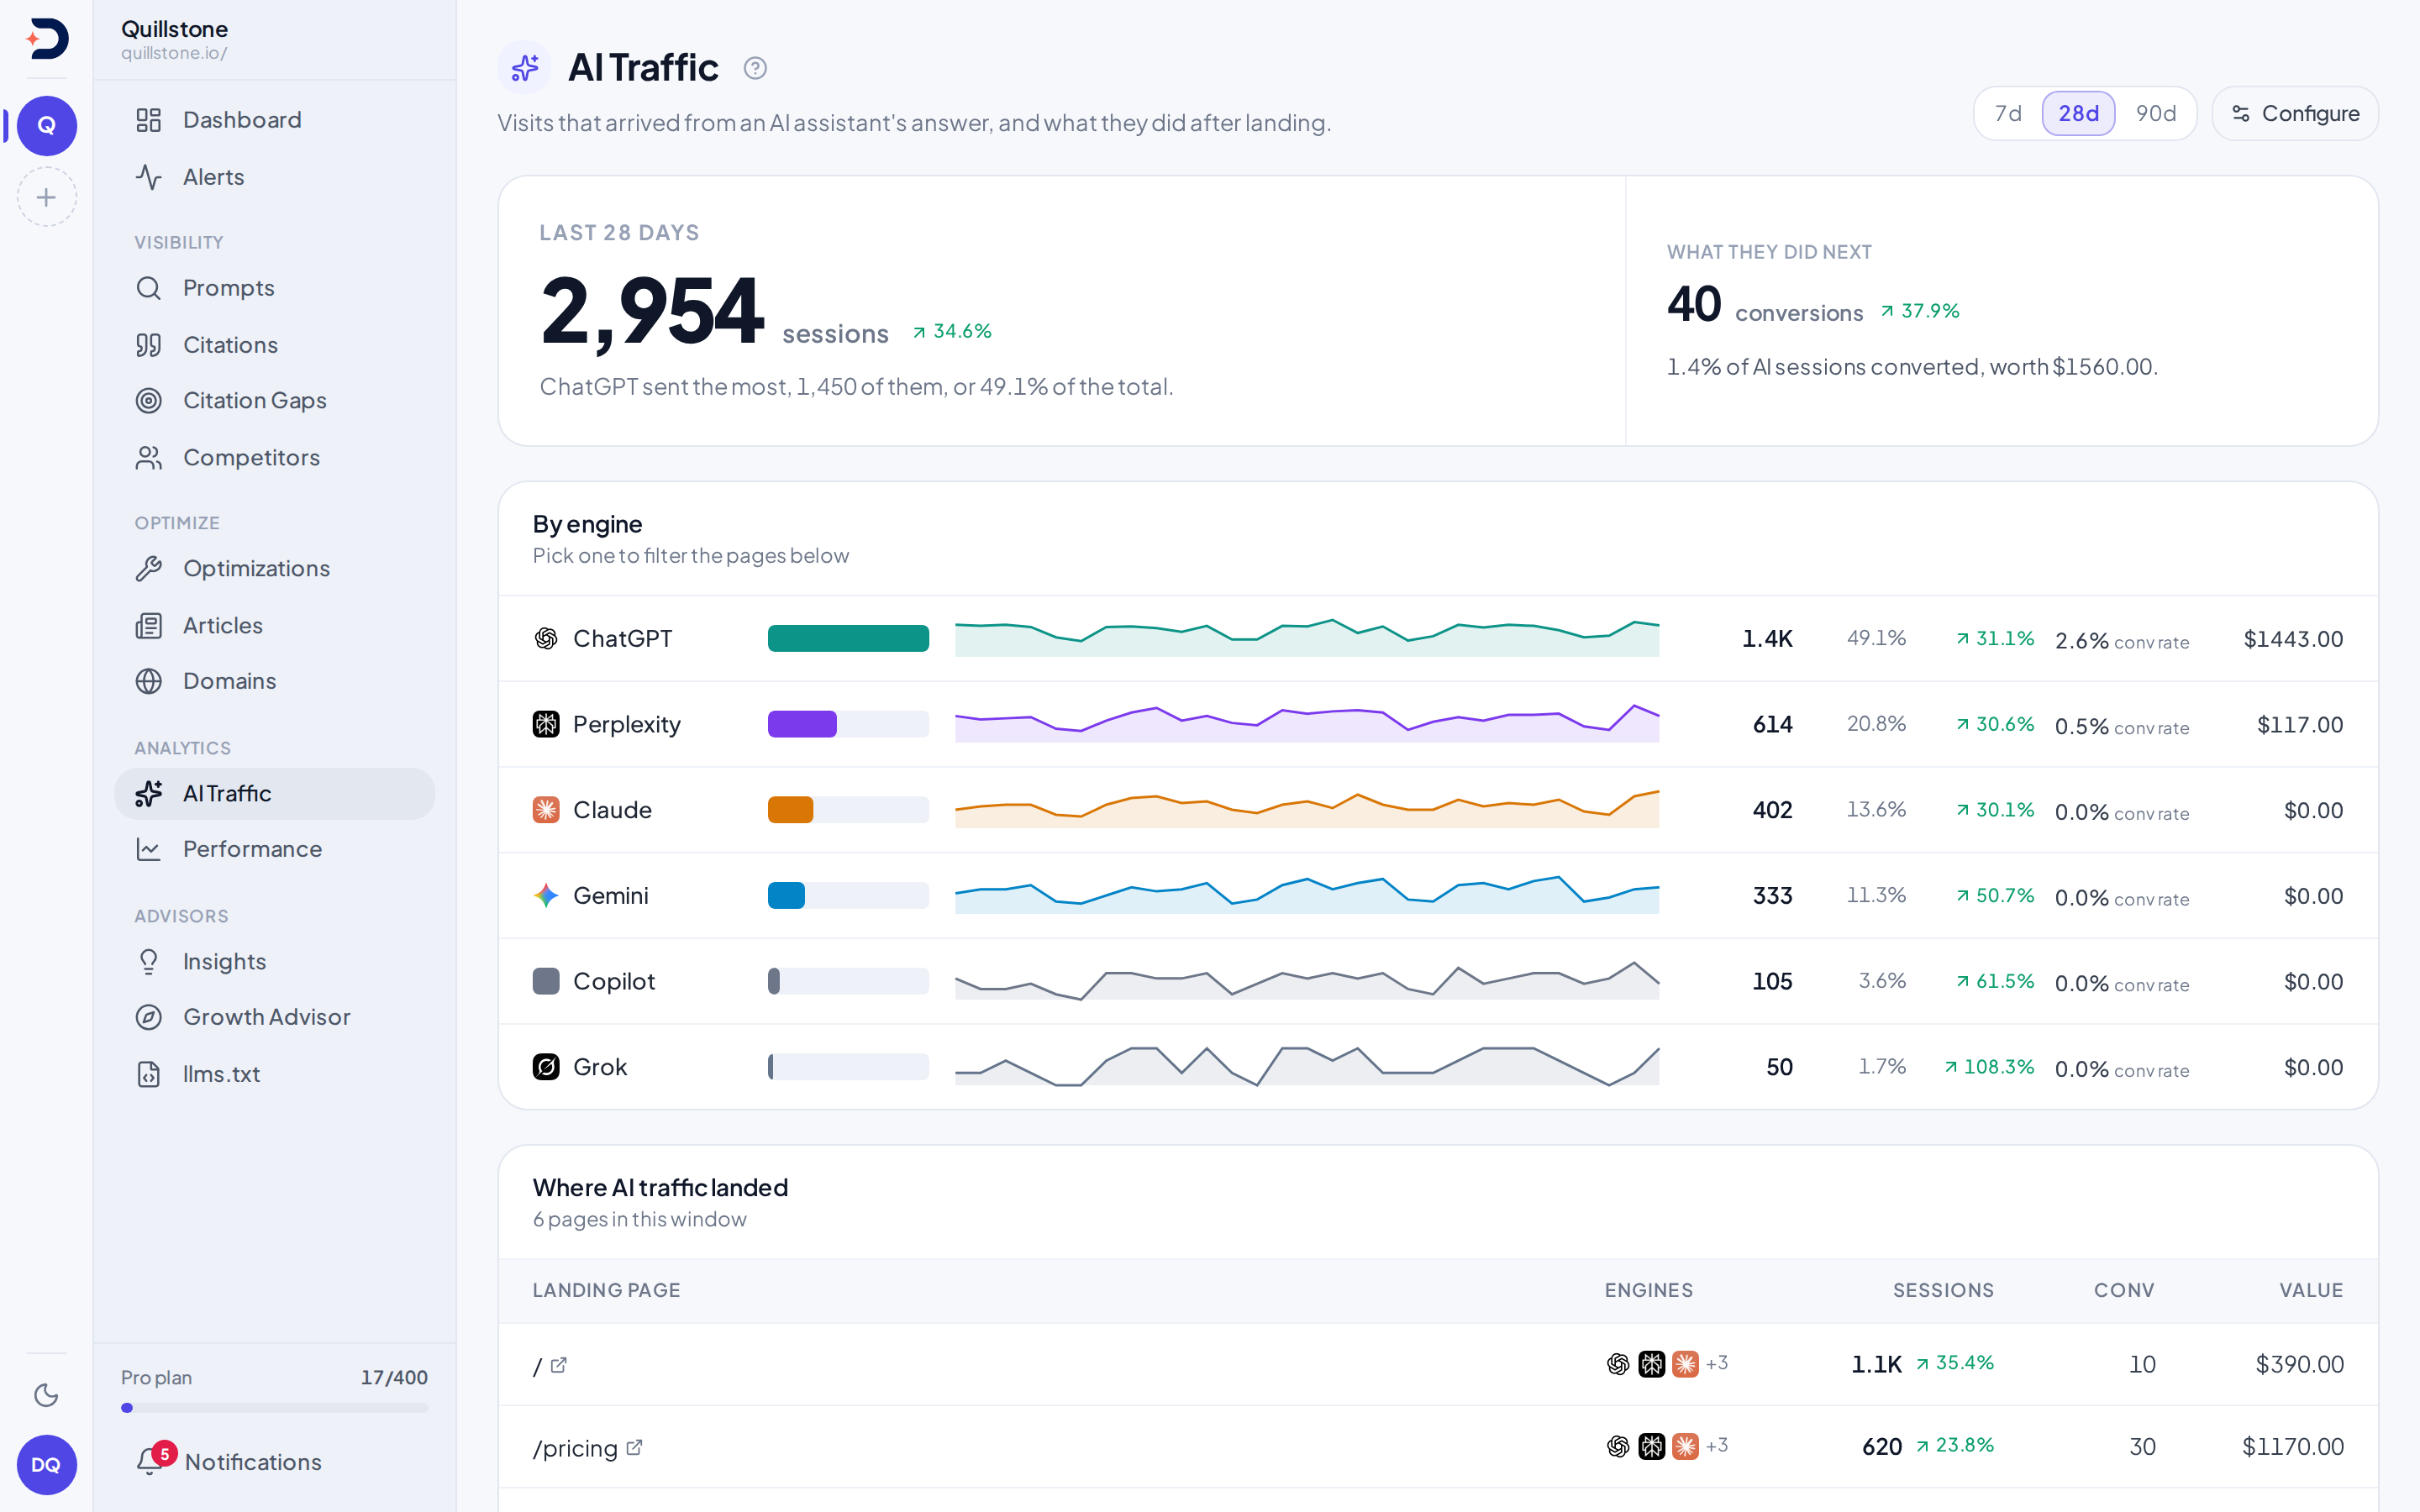
The hero number is total sessions for the window, with a breakdown by engine
underneath, each row carrying its share of the window's traffic and, where
that engine also had traffic in the prior window to compare against, a
change figure; an engine appearing for the first time shows no change at all
rather than a percentage measured from zero
(api/services/integrations/google/ai_referral_metrics.py#engine_summary,
frontend/src/lib/components/DeltaChip.svelte#delta).
The filter bar's
engine chip narrows every figure on the screen to the visits that engine's
assistant sent, by the referrer classification above: ChatGPT (app) to
the ChatGPT referrer, either Gemini engine to the one Gemini
referrer, so Gemini (API) and Gemini (app) show the same Gemini visits,
Claude to Claude's, and likewise for Grok and Perplexity
(api/services/integrations/google/ai_traffic.py#referral_conditions,
api/routers/integrations.py#AI_TRAFFIC_ACCEPTS). When that engine sent
nothing in the window, the screen says so and offers Show all engines.
Choosing Google AI Overviews or Google AI Mode always reads that way,
because there is no referrer to narrow to.
Selecting a row under By engine drills into that one referrer, and the
address carries it as ?referrer=, so a drill-down can be linked. This works
for every referrer, including the ones only traffic reports, such as
Copilot (api/routers/integrations.py#list_ai_traffic). The hero sessions
figure, its prior-window delta, and the conversion figures switch to that
referrer's own numbers, and the landing-page table narrows to the pages it
sent traffic to. The row's own share still tells you how much of the
window's traffic that referrer accounts for
(frontend/src/routes/(app)/ai-traffic/+page.svelte#sessions).
Selecting the same row again, or Show all referrers, returns every
figure to the window's total: every referrer's, or the chosen engine's when
the engine chip is set. Following a link that names a referrer
with no visits in the current view lists every page, with a plain note
saying so and a way to clear it, instead of a table that just looks
filtered
(frontend/src/routes/(app)/ai-traffic/+page.svelte#staleFilter). An old
link that named the referrer as ?engine=chatgpt reads as no engine chosen
and shows all traffic, because the engine chip takes an engine, not a
referrer.
Landing pages are ranked by sessions, each with the engines that sent it
traffic and, again only where it drew traffic in the prior window, its own
change against that window
(api/services/integrations/google/ai_referral_metrics.py#aggregate_pages).
The list is capped at the top 50 pages by session count; past that point the
page reads "Top 50 pages by sessions" rather than a full count, so a site
with more AI-referred landing pages than that sees the leaders, not
everything (api/routers/integrations.py#AI_TRAFFIC_PAGE_TOP_N,
frontend/src/routes/(app)/ai-traffic/+page.svelte#PAGE_CAP).
Conversions
Whether the screen shows conversion numbers at all is decided once, for the
whole window: if total conversions across every engine are zero, the screen
shows a prompt to name your conversion events instead of a row of zeros,
even narrowed by the engine chip or a referrer to one that happens to have
none
(frontend/src/routes/(app)/ai-traffic/+page.svelte#hasConversions). That
keeps the layout in place as you switch engines rather than jumping every
time.
Conversions are not counted at the level you read them. The import asks GA4
for one row per day, page, source, medium, and country, and each of those
rows arrives carrying two figures: GA4's own conversion count for it, the
property-level metric GA4 already flags as a conversion, and GA4's revenue
total for the same row
(api/services/integrations/google/ga4_attribution.py#import_ga4_daily_for_project,
#_upsert_metrics). A second query then replaces both figures together, row
by row, wherever one of your named conversion events fired on it, substituting
the count and the value GA4 recorded against your events there; if you have
not named any, the same replacement runs using GA4's own purchase and
sign_up events instead
(api/routers/integrations.py#update_conversion_events,
api/services/integrations/google/ga4_attribution.py#_load_project_context,
#_fetch_conversion_overrides, #_DEFAULT_CONVERSION_EVENTS). So naming
events does not restrict what counts: it overrides GA4's own figures on the
rows where your events fired, and GA4's own figures stand everywhere else.
Every conversion figure on the screen is built from sums of those underlying
rows: the hero's conversion count, its rate, and the value beside it; each
engine's rate and value; and each landing page's count and value
(api/services/integrations/google/ga4_attribution.py#_rebuild_ai_referral_attribution,
api/services/integrations/google/ai_referral_metrics.py#engine_summary,
#aggregate_pages,
frontend/src/routes/(app)/ai-traffic/+page.svelte#conversionValue). What
you read is therefore a mixture, not one thing or the other: GA4's own count
and revenue across every underlying row where none of the counted events
fired, and those events' own count and value across the rows where they did.
Where the events being counted carry no revenue of their own, a value figure
lands below GA4's revenue for the same sessions by whatever the replaced
rows would otherwise have contributed.
The prior-window comparison for conversions is built for the window's total,
not broken out per engine, so a single engine's row does not carry its own
conversion change chip
(api/services/integrations/google/ai_referral_metrics.py#engine_summary).
The window, and how the two periods compare
Left alone, AI Traffic opens on the last 28 days. The filter bar's date
range chip switches it to 7, 28 or 90 days, carried in the URL as
?days=; any other value in the URL reads as 28, so 90 is the widest window
this screen shows (frontend/src/lib/filters.js#readDays).
Every change figure on this screen, the hero sessions number, each engine's
row, and each landing page's row, compares the selected window, the days
ending yesterday, against the same number of days immediately before it:
not a fixed prior period or a year-over-year figure
(api/routers/integrations.py#ai_traffic_summary, #list_ai_traffic).
No tile on Overview
Overview has no AI traffic tile. AI referral sessions, conversions and the
by-engine breakdown are read here, on this screen
(frontend/src/routes/(app)/ai-traffic/+page.server.js#load).
The weekly report reads the same summary, over the
report's own week and with no engine chosen, when it is built
(api/services/integrations/google/ai_traffic.py#summarize_ai_traffic,
api/services/weekly_report.py#_assemble_revenue).
Before you see data
AI Traffic needs Google Analytics 4 connected and a GA4 property mapped to
this project; either without the other leaves the screen showing a setup
prompt instead of a chart
(frontend/src/routes/(app)/ai-traffic/+page.server.js#ga4Connected,
#propertyMapped). The moment a property is mapped, whether that happens
automatically right after you connect or you map one yourself afterward,
its one-time 180-day history import is queued immediately rather than
waiting for the daily timer, so the pull that populates the full 90-day
window this screen allows begins right away
(api/routers/integrations.py#map_ga4_property_to_project,
#_enqueue_initial_import, #_enqueue_ga4_discovery,
api/tasks.py#discover_and_map_ga4_task,
api/services/integrations/google/ga4_attribution.py#import_ga4_daily_for_project,
#_BACKFILL_WINDOW_DAYS). If that immediate enqueue itself fails, the next
daily run backfills any property still missing its history, so a rare
miss costs a short delay, not a lost import. After that first pull, the
same scheduled import that feeds Traffic → Site traffic also rebuilds this
screen's numbers, once a day
(#_rebuild_ai_referral_attribution); see
Troubleshooting: Search or Site traffic is empty
for exactly when that recurring import runs.
Related
- Citations: the mention-to-source side this page's traffic is the outcome of
- Google rankings versus AI citations: why a citation and a click are different wins
- Troubleshooting: what an empty or stale-looking screen usually means
Last verified 2026-09-29