Advisors
Weekly report
A dated report for each week, built from your own numbers with no model in the loop, readable on screen, by email, and on paper.
What this is
Weekly report is a dated report built
once a week for every project it runs for: one hero number, the prompts that
moved, where you stand against competitors, and a short list of what to do
next, assembled automatically rather than something you have to go generate
yourself (api/services/weekly_report.py#generate_weekly_report). It is
gated on your plan; see Pricing. A project on a plan the report is not
included in sees a locked screen instead, with no report and no history to
browse (api/routers/insights.py#get_latest_insight).
No model in the loop
The generator never calls a language model. It reads numbers the product
already computes, by calling the dashboard API, AI referral traffic, and
Search Console handlers directly, then formats the results in
plain Python: build_headline writes the one-sentence summary from rounded
deltas, build_scorecard reshapes the dashboard API's citation rate,
brand visibility, citation share and average citation rank into the stored
scorecard, and _movers sorts prompts into risen or fallen by the
sign of their change, leaving out a prompt whose change is exactly zero.
An engine counts as measured in a week only when it ran (an answer, or a
Google run that showed no AI answer) on at least 80% of the week's answered
days, the days on which any engine has an answer (6 of 7 when every day was
answered) (api/services/collection_health.py#WINDOW_PRESENCE_MIN_PERCENT). When some engine that answered in either
week was not measured in both (the Google engines, ChatGPT (app) or Gemini
(app) in the week after launch, or an engine switched off during the week), every
change, the prompts that gained or slipped and the competitors that surged
are compared over the engines measured in both weeks only, and a summary
that reports a brand visibility change
adds "Change compares engines measured in both weeks." (a summary with no
visibility comparison does not, even when its prompt or competitor counts
compare only the shared engines; a week where visibility held steady still
counts as a comparison and gets the note) (api/services/collection_health.py#engine_windows)
(api/services/weekly_report.py#generate_weekly_report, #build_headline,
#build_scorecard, #_movers). Neither that call graph nor the task that
runs it imports the platform's LLM gateway anywhere.
The week, and when it runs
A report's week is always the last complete Monday-to-Sunday week in UTC:
week_start is a Monday and week_end is six days later, the Sunday before
the run (api/services/weekly_report.py#week_bounds). The week is chosen by
snapping back to that Monday, not by counting seven days back from the run
date, so a run delayed past its Monday still produces the week the on-time
run would have produced rather than a shifted seven-day window. Every
reading in the report measures that same week
(api/routers/dashboard.py#build_dashboard).
There is exactly one path that builds a report: a systemd timer fires every
Monday at 06:30 UTC, which enqueues one generation job for every paid,
active project without a report for that week yet, and each job runs the
generator for its one project
(discoveredby-cli@enqueue-weekly-report.timer,
api/tasks.py#_enqueue_weekly_report_for_eligible_projects,
#generate_weekly_report_task). There is no on-demand trigger: nothing in
the app, and nothing in the internal admin panel, builds a report outside
that weekly run. A project with no AI-search snapshot recorded inside that
week is skipped rather than shown an empty or partial week
(api/services/weekly_report.py#_enough_data).
What's on the screen
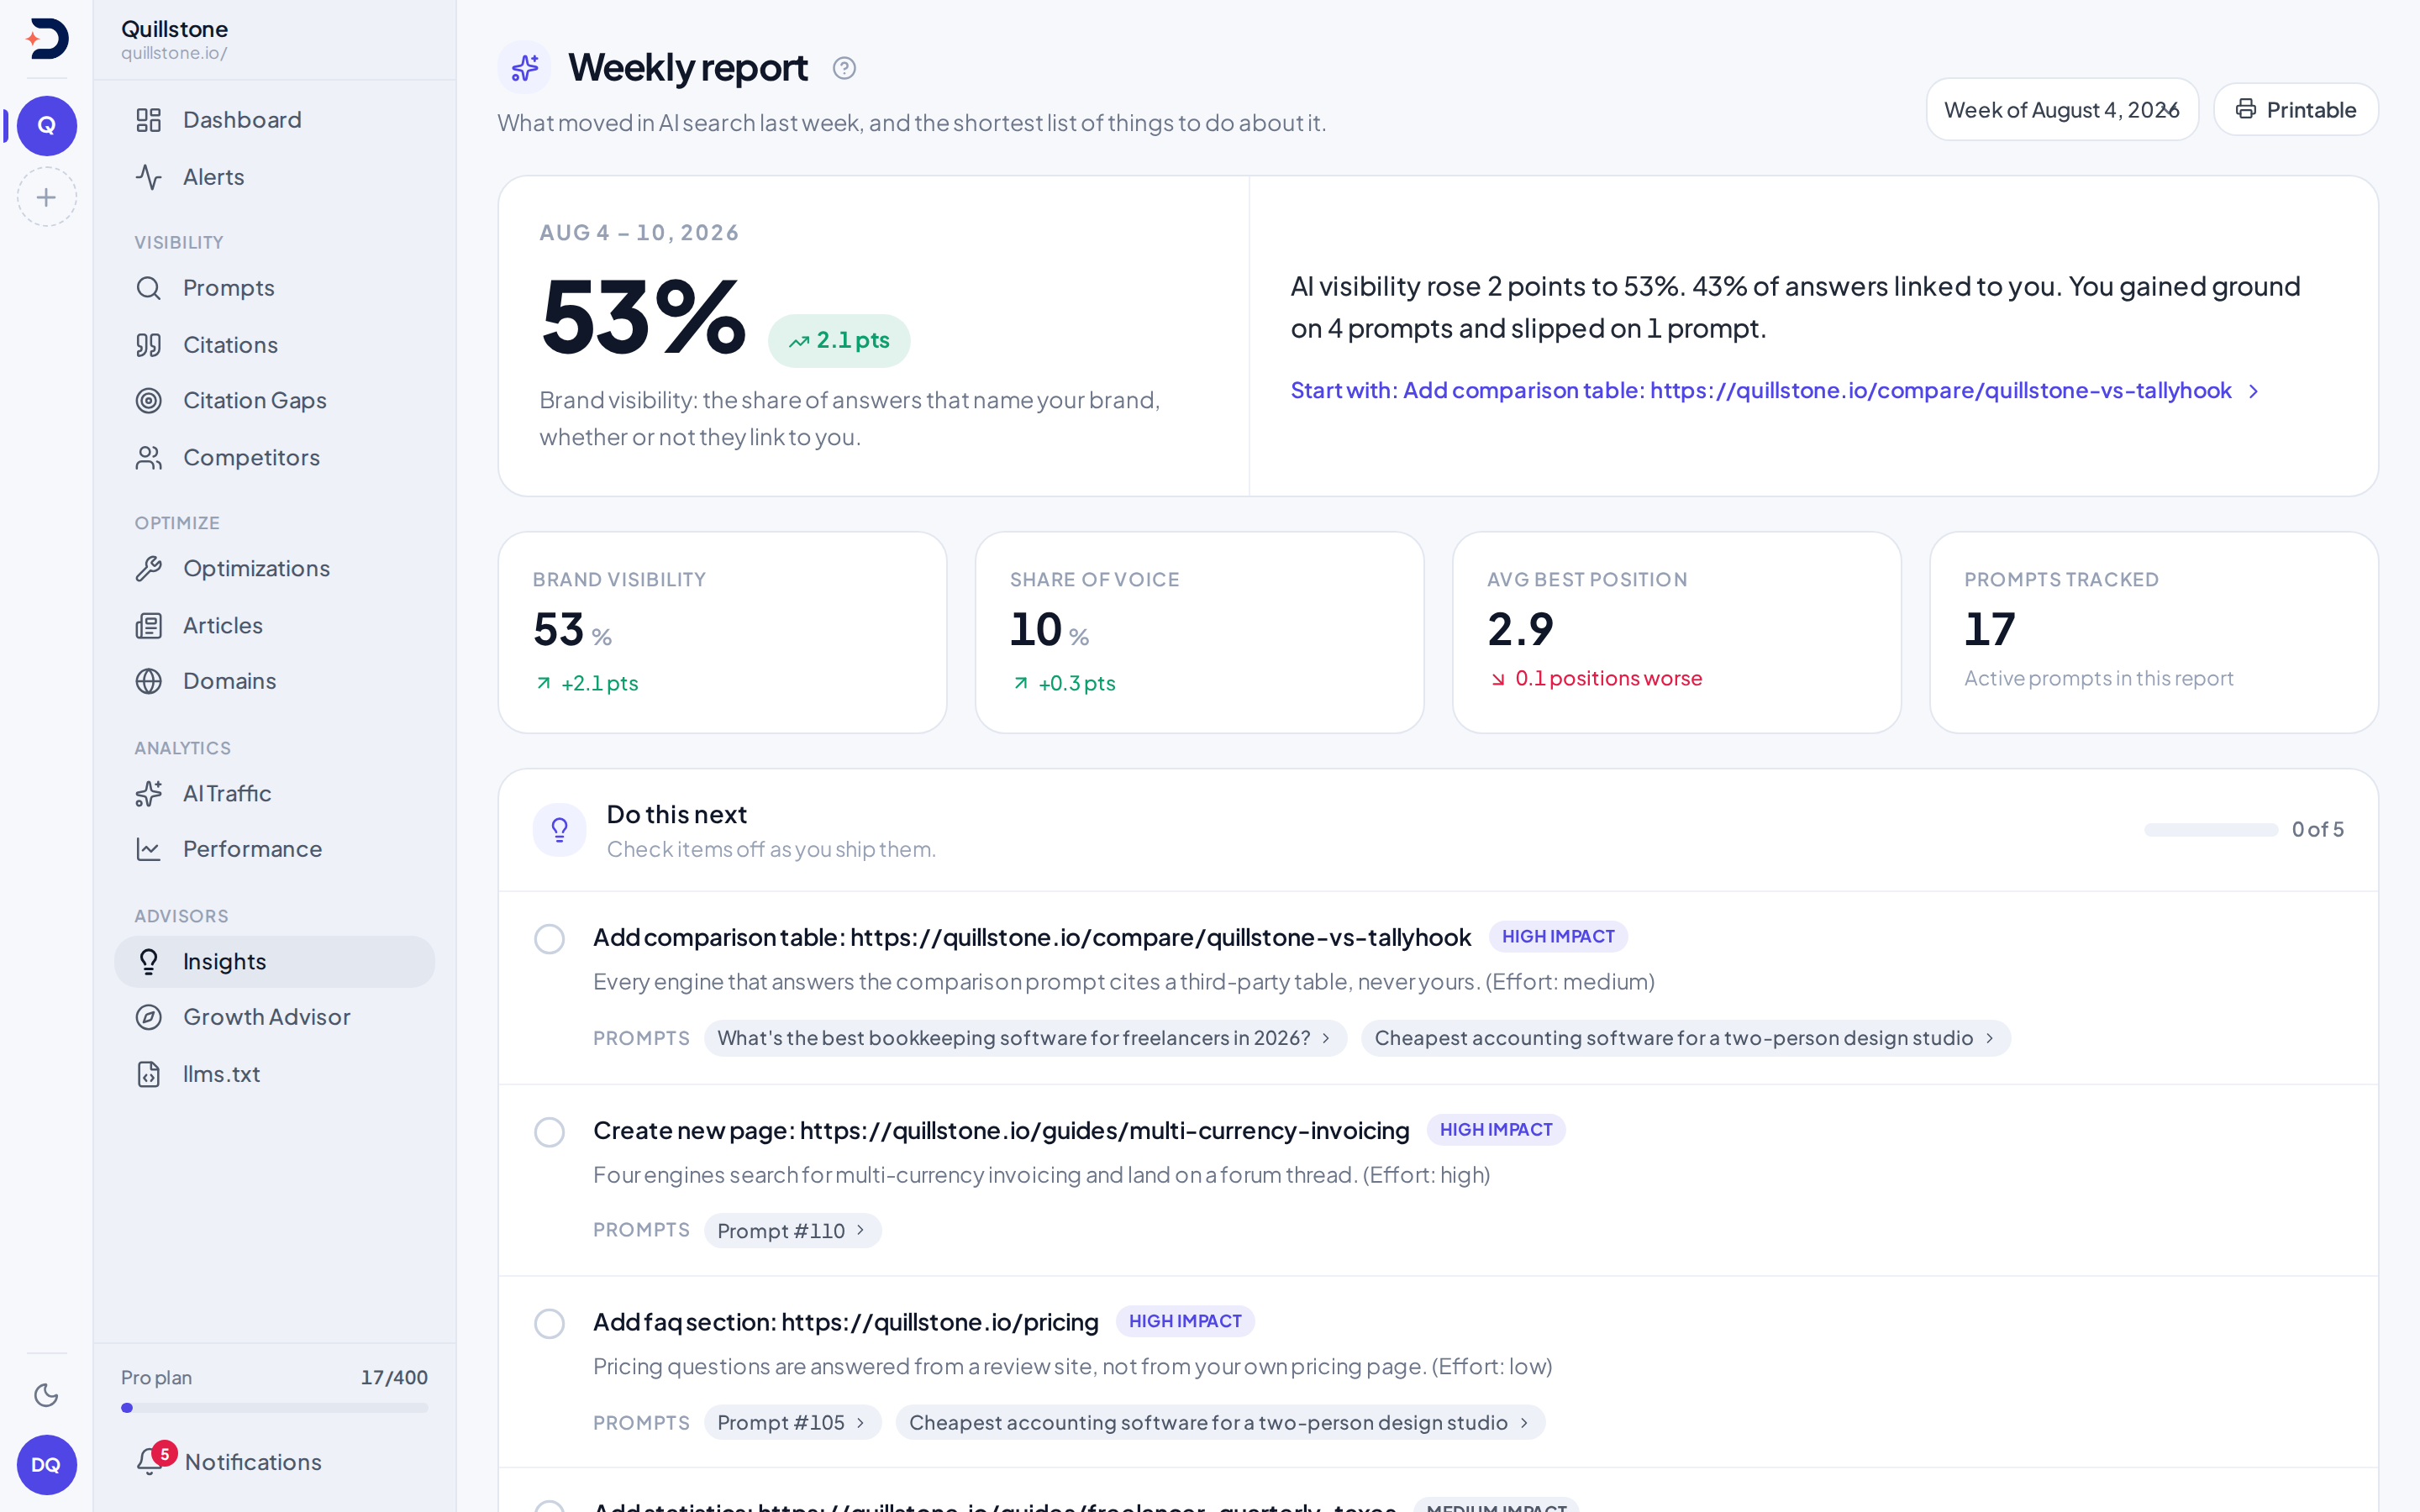
The hero is brand visibility when the report carries a real reading for it,
and falls back to citation rate otherwise, each with its own one-line
definition and a note of how it moved from the week before
(frontend/src/routes/(app)/insights/+page.svelte#heroValue). Beneath it
sit three tiles, citation share, average best position, and prompts
tracked, joined by one more tile repeating the hero's own brand visibility
figure when that reading exists; average position reads blank for a week
where nothing of yours was cited at all
(frontend/src/routes/(app)/insights/+page.svelte#avgRank).
Whether a reading counts as measured depends on which generator wrote the
report. Reports written from 2026-09-19 record a reading with no data
behind it as empty, so a 0% on one of them is a real measurement of
zero. Older reports stored that same "no data" case as zero, which is
indistinguishable from a measured zero, so a reading there is only trusted
when the value, the previous week or the change is nonzero; otherwise the
tile reads – and the hero says the week was not measured. This is why an
older report can omit brand visibility entirely. One rule covers this
screen, the printable page, the weekly email and shared client links, so
they cannot disagree about the same week
(api/services/weekly_report.py#METRICS_VERSION, #reading_is_measured,
frontend/src/lib/insights.js#readingValue).
A change is left blank rather than shown as 0 when there is no comparable
week before it, since a zero there would claim the metric held steady
against a week that was never measured
(api/services/weekly_report.py#_hero_delta).
A "Do this next" checklist holds the five highest-impact citation gap
opportunities on file for your project
(api/services/weekly_report.py#select_recommendations). Editors and owners
can check one off as done; a viewer sees each check circle disabled, with a
role notice above the list explaining why, rather than a click that would
be rejected
(api/routers/insights.py#toggle_recommendation,
frontend/src/routes/(app)/insights/+page.svelte#writable). What gets checked off
carries forward: next week's report shows how many of that list got done
(api/services/weekly_report.py#progress_from_prior). Further down: the
prompts that gained or lost ground
(frontend/src/routes/(app)/insights/+page.svelte#rising, #declining),
how you compare engine by engine and against your tracked competitors, each
with its own message when there is nothing to compare yet
(#engines, #hasEngineData, #competitors). An engine's row is the
share of the answers it completed that week that cited your own domain,
counting every day it ran, so an engine that ran and was never cited shows
a real 0%. An engine that completed none of your prompts that week is left
out rather than shown at zero (a Google engine that showed no AI answer on
any run that week included, since a run with no AI answer is not a
completed answer), and a week where no engine ran says so
instead of saying no engine picked you up. An engine's week-over-week change
is shown only when the week before also has a score for that engine
(api/routers/dashboard.py#_engine_breakdown, #_self_daily_runs,
api/services/weekly_report.py#generate_weekly_report). Reports generated
before this rule stored a row for every engine, at 0% when it did not run,
and could measure a change from that 0%, so on an older report a 0% row
cannot be told apart from an engine that never ran and no engine change can
be trusted. The screen and the printable page therefore leave out an older
report's 0% engine rows, the screen shows none of its engine changes, and
both say why in a one-line note
(api/services/weekly_report.py#METRICS_VERSION,
frontend/src/lib/insights.js#engineRows). Those older reports also used a
different per-engine definition: they divided only by the days your domain
was cited, where current reports divide by every day the engine ran. A drop
from an older week to a newer one can therefore be the definition changing
rather than a real fall, and the same note says so. A competitor's
week-over-week change is left blank when the week before had no completed
runs, rather than counting its whole visibility as a gain, and such a
competitor is not counted as surging in the headline
(api/services/weekly_report.py#generate_weekly_report). Then, only when there is something to show, AI
referral traffic from Google Analytics
(frontend/src/routes/(app)/insights/+page.svelte#revenue),
striking-distance Search Console queries (#quickWins), a sentiment
breakdown (#sentiment, #hasSentiment), and a receipt of articles
published, pages optimized, and prompts added that week
(#receipt, #shipped).
Screen, email, and paper
The same report reaches you three ways. On screen, at the Weekly report
page linked above. By email, sent the moment a report first finishes
generating when owner email preferences and weekly-report entitlement allow it,
built from the same stored numbers and summary sentence
(api/tasks.py#_email_weekly_report,
api/services/email.py#send_weekly_report_email). And on paper: a
"Printable" link opens a second page built for print, reading the same
stored numbers and hiding the app's own navigation chrome behind a print
stylesheet. It is a one-page digest rather than the whole screen: the hero,
which prints citation rate with brand visibility above it when the report
carries a real reading for that
(frontend/src/routes/(app)/insights/report/+page.svelte#hasBrandVisibility),
where you stand engine by engine, what shipped that week if anything did,
and the top three moves from that week's "Do this next" list. The tiles, the
prompts that moved, the competitor comparison, the AI referral traffic and
Search Console sections, and the sentiment breakdown stay on screen. There
is no PDF file the product builds. Turning that printable page into a PDF
means using your browser's own print dialog, the same as printing any other
web page.
Client sharing
Owners and editors can choose Client links to preview and share a fixed digest of a generated week. Links work without sign-in, expire after 1, 7 or 30 days, and can be revoked. The client page contains a smaller set of fields than this screen. Review the exact preview before creating a link. See Client report links for contents, permissions, measurement caveats and access checks.
History
Past weeks are one click away once more than one exists: a dropdown lists
every week with a generated report
(frontend/src/routes/(app)/insights/+page.svelte#availableWeeks), and
picking one fetches that specific week without changing anything else on
screen (api/routers/insights.py#get_insight_for_week). A project not on a
plan the report is included in cannot reach a past week either, the same
gate as the latest one.
Across client projects
Open the Client reports tab under Reports in the sidebar to review the same completed week across your active projects, with separate readings and access states. Choosing Open report switches to that project and exact week. A requested week that is no longer available shows an error instead of substituting the latest report. See Client reports.
Related
- Metrics defined: the formulas behind brand visibility, citation rate, and the other figures on the scorecard
- Citation gaps: how the opportunities behind "Do this next" are found and scored
- Competitors: the comparison this report's "against competitors" section reuses
- Search performance: where this report's striking-distance queries come from
Last verified 2026-09-28