What missing collection days do to an AI visibility trend: a review method
Days when no AI answers were collected can bend a visibility trend without any real change. A worked example and a copyable missing-data checklist show how to choose a comparable window.
On this page
- In short
- What is a "missing collection day"?
- What does a failed run do to the numbers?
- When do gaps distort a trend, and when do they not?
- How do you find the gaps before you read the trend?
- The missing-data review checklist
- How do you choose the comparable window?
- A worked example: a fall that was only a gap
- How does 7-day smoothing change the picture?
- What this method cannot tell you
- Common mistakes
- Frequently asked questions
- Next step
Missing collection days do not lower your AI visibility. A day when an engine returned nothing adds no answers to the count, so it never counts as a miss. The danger is different: a gap can change which prompts and engines make up one period, and then a fall or rise in the trend reflects the mix that got collected, not what the engines said. The fix is a review before you read the line: find the gaps, name their cause, and compare only windows that were collected in the same way.
In short
- A failed or absent run is not a zero. It leaves the numerator and the denominator, so a rate shrinks in sample size instead of dropping.
- The distortion comes from uneven gaps. If failures hit one prompt group or one engine, the periods you compare are no longer made of the same answers.
- Look for gaps on a daily grain, broken down by engine, before you trust a weekly or monthly number.
- Choose the comparison window by rule (same prompts, same engines, enough days), and write the decision down.
- A day with no Google AI answer is a result, not a gap. Separate it from a failed run (covered in zero mentions, no answer or failed collection).
What is a "missing collection day"?
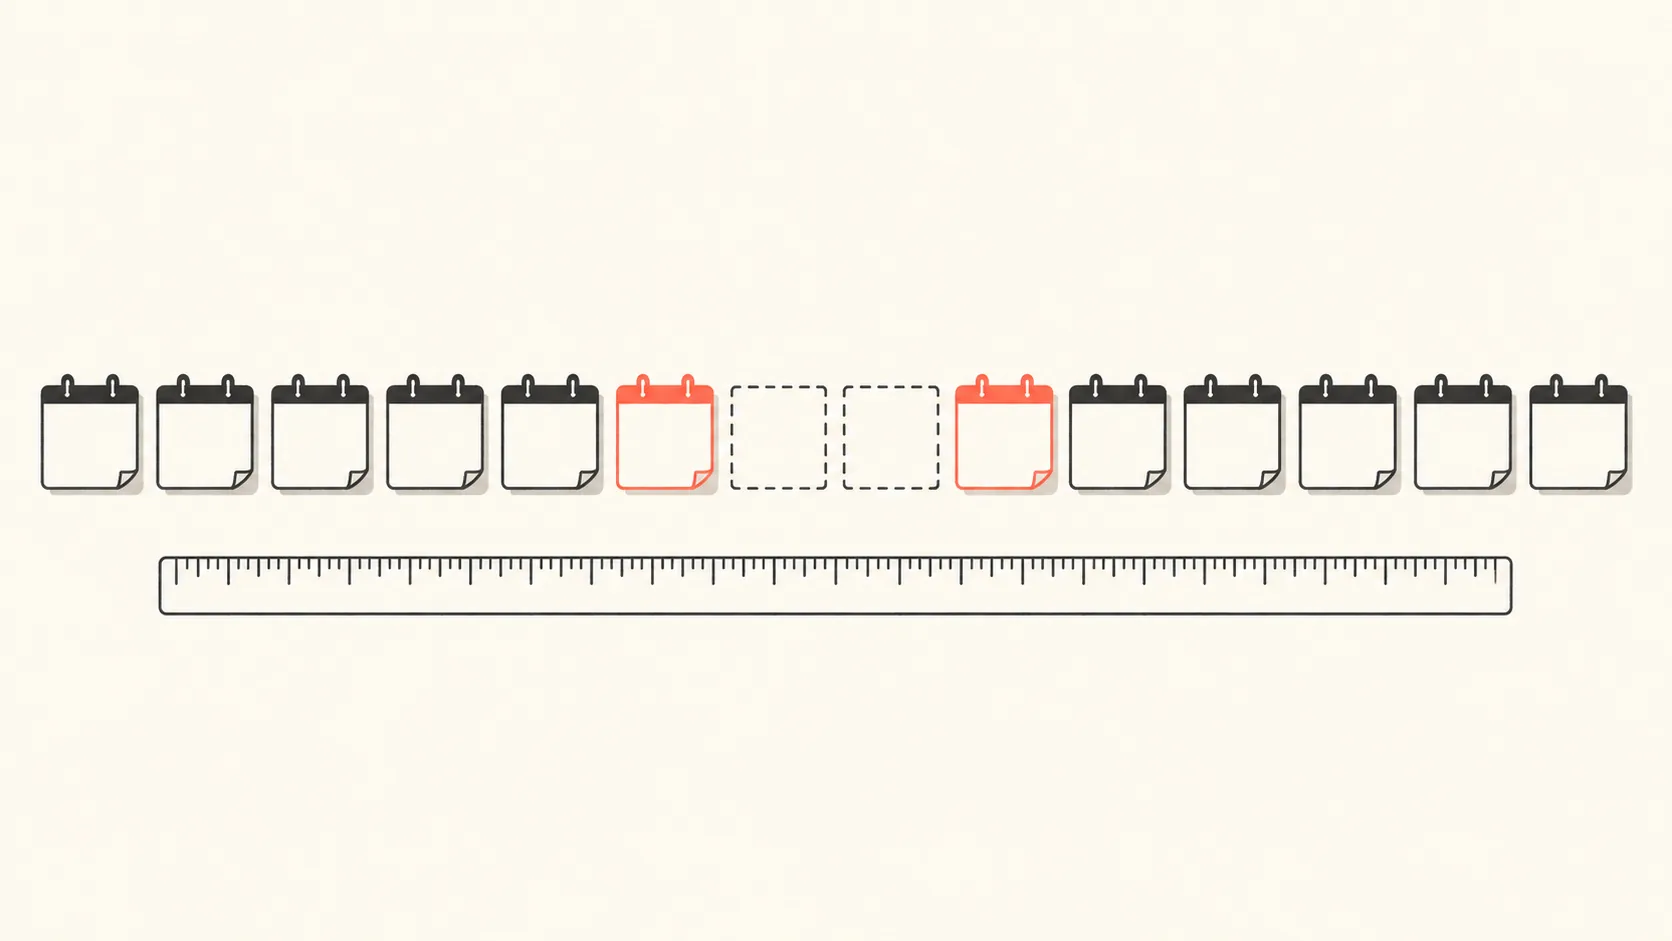
A missing collection day is a calendar day on which fewer completed answers exist than you planned for, for one prompt, one engine or the whole project. The cause may be a failed run, an engine that was switched off or unavailable, a prompt that was paused, or a project that had not started yet.
Some terms used throughout this post:
- A collected answer is a completed prompt execution: the engine ran and returned a result. It is the unit most of the numbers divide by. A run that failed is not a collected answer.
- An analysed answer is a collected answer whose brand mentions have also been extracted. Extraction runs after collection, so the most recent days can look thinner in brand metrics for a while.
- A comparable window is a pair of date ranges in which the same prompts ran on the same engines on enough of the days, so a difference between them can be read as a difference in the answers.
Not every quiet day is a gap. A Google AI Overviews or AI Mode run can succeed and still show no AI answer. That run is reported as a shown rate instead of an answer metric (shown rate), and it is a real observation about the engine, not missing data. The engines reference explains the difference in When Google shows no AI answer.
What does a failed run do to the numbers?
A failed run does nothing to your metrics: it is absent from the count, not counted as a miss. The troubleshooting page states it plainly: every answer metric is built from executions whose status is completed, so a run that failed to get an answer does not drag visibility, citation rate or share of voice down (A run failed).
That is good news for the value of a rate, and bad news for its precision. A rate with fewer observations behind it is a noisier rate. The product marks a rate built from fewer than 30 observations as provisional, and a metric with nothing in its denominator has no value, drawn as an en dash, never as zero (Explorer, Metrics defined).
Two recovery mechanisms matter before you call a day missing. A failed run is retried automatically later the same day, at 03:00, 05:00, 09:00 and 17:00 UTC, and a retry that succeeds replaces the failed run with the answer. If the 17:00 retry also fails, the run stays failed for that day. So check a gap after the last retry has run, not while the day is in progress.
When do gaps distort a trend, and when do they not?
Gaps distort a trend when they are uneven: when the answers that went missing are different in kind from the ones that remain. Evenly spread gaps only make the line noisier.
Think of the visibility rate as a weighted average. Each prompt (or engine) has its own rate, and the overall rate weights them by how many answers each contributed. If a period loses answers from a prompt group with a high rate, the overall rate falls even though no group changed. If it loses answers from a low-rate group, the overall rate rises. Nothing is wrong with the arithmetic; the two periods are simply made of different populations.
Three patterns are the ones to look for:
- A whole-project gap (no engine collected on some days). Rates are pooled, so the gap alone does not pull the level down; the sample shrinks. The risk is provisional numbers and a hole in any day-by-day line.
- One engine's gap. A pooled number weights engines by how many answers each returned. When an engine drops out for part of a period, the pooled rate shifts toward the other engines' behaviour. The Explorer pools engines unless you break down or filter by engine.
- One prompt group's gap. If failures cluster on certain prompts (for example those in one language), the surviving mix changes.
The product itself protects some of its own comparisons from the engine version of this problem. An engine counts as measured in a period only when it ran (an answer, or a Google run that showed no AI answer) on at least 80% of that period's answered days, the days on which any engine has an answer; that is 6 of 7 when every day was answered. The Overview's changes, the dashboard, the weekly report and alerts compare only the engines measured in both periods (Reading your first results, Engines). By that rule, when every day of a 7-day window had an answer from some engine, an engine that ran on 6 of the 7 days still counts, while one that ran on 5 does not.
The comparisons you build yourself do not get that protection. An Explorer comparison, an Analyst answer and a saved dashboard compare whatever engines you select, so with every engine selected, one that answered in only one period counts in whichever period it answered. The Explorer docs advise breaking the result down by engine, or filtering to one, to compare like for like (Explorer).
How do you find the gaps before you read the trend?
Find gaps by counting what was collected, on a daily grain, split by engine, before you look at any rate. Use the metric Answers collected with a daily time grain and an engine breakdown. The Explorer allows a day grain for windows of up to 92 days and one breakdown with a time grain, and a line chart draws up to 10 lines with the full table of rows underneath (Explorer).
Then read the table, not only the picture. For each engine, compare each day's count to the number you expect: the number of active prompt targets that run on that engine. A prompt target is one prompt tracked in one location, for one audience and one language, and the daily job enqueues one run per active target on each engine that runs it. Not every engine runs every persona, language or city target, so the expected number can differ by engine (Explorer). A day well under that number is a candidate gap.
To find out why, open the affected prompt's run history. It lists the executions for the chosen window, failed ones included, with status and a plain-language reason drawn from a closed set (timeout, rate limited, provider error or internal error), up to the 50 most recent, and 90 days is the widest window (A run failed). Two other explanations are worth ruling out because they look the same on a chart:
- A paused prompt or target. Paused prompts and targets still count when they have answers in the window, but they collect nothing while paused, so the count steps down.
- An engine that stopped running. An engine can be missing from your project for a reason unrelated to your plan: if its key is not currently configured, it will not run for anyone until the key is back. Its past answers keep its name and no new answers arrive (Engines).
Finally, check whether the shortfall is a Google engine showing no AI answer. That is a result to be read as a shown rate, and it does not belong in a missing-data log.
The missing-data review checklist
Work through this list every time you are about to report a trend or a change over a period that contains a suspected gap. Copy it into your reporting notes.
MISSING-DATA REVIEW: <project>, window <start> to <end>, compared with <start> to <end>

1. Grain. Did I look at Answers collected per day?            [ ] yes
2. Split. Did I split by engine?                              [ ] yes
3. Expected count per engine per day = ____ (active prompt targets that run on that engine)
4. Gap days found (date, engine, how many answers short):
   ______________________________________________
5. Cause of each gap (check one per row):
   [ ] failed run, stayed failed after the 17:00 UTC retry
   [ ] engine unavailable or switched off
   [ ] prompt or target paused
   [ ] project or prompt not started yet
   [ ] Google run with no AI answer (a result, not a gap)
   [ ] unknown (investigate before reporting)
6. Were the gaps spread evenly across prompt groups and engines?
   [ ] yes, sample is smaller but the mix is the same
   [ ] no, the mix changed
7. Observations behind each rate I plan to quote (30 or more?)  ____
8. Decision (see table): A, B, C or D
9. Note to put next to the number: _______________________
10. Re-check date (after late retries or a backfill): ________
How do you choose the comparable window?
Choose by asking whether the surviving answers still describe the same population in both periods. The decision table below turns that into four options.
| Situation | Decision | What to do in your tool |
|---|---|---|
| Gaps are short, spread across prompts and engines, and every rate keeps 30 or more observations | A. Compare as is | Report the change and add a note naming the gap days. |
| One engine has gaps (or started or stopped answering) in one period only | B. Compare like for like by engine | Break down by engine or filter to engines that ran in both periods; report per engine. |
| Failures hit particular prompts, tags or languages | C. Restrict to the intact set | Filter both periods to the prompts (or tag) with complete collection, and say the reported set is narrower. |
| A long or unexplained gap, or a rate under 30 observations | D. Shorten or hold | Use a custom window that starts after the gap, or wait for enough days, and label the result provisional. |
Options B and C use the dimensions the Explorer offers: engine, prompt and tag are all filters, and a custom window can run for up to 366 days and must end yesterday or earlier (Explorer). The Explorer's comparison options are previous period and last year, and in a time series the n-th day or week of the earlier period is paired with the n-th of the window. A gap in either period thins the pairs it touches, so check that both periods have a similar run of collected days before you accept a change.
A worked example: a fall that was only a gap
Quillstone tracks 10 prompts on one engine, every day. Five are "best document review software" style prompts (group A) and five are "Quillstone versus Brieflane" style prompts (group B). It compares two 7-day periods on brand visibility, the share of analysed answers that name the brand.
Period 1 (all 7 days collected). Group A: 35 answers, 7 name Quillstone (20.0%). Group B: 35 answers, 21 name Quillstone (60.0%). Together: 70 answers, 28 naming Quillstone, so 40.0%.
Period 2. The engine had a provider error on three days that hit only the group B runs, and those runs stayed failed after the 17:00 UTC retry. Group A: 35 answers, 7 name Quillstone (20.0%). Group B: 4 days of 5 prompts, so 20 answers, 12 name Quillstone (60.0%). Together: 55 answers, 19 naming Quillstone, so 34.5% (19 divided by 55).
A dashboard that only shows the pooled rate reads 40.0% then 34.5%: a fall of 5.5 percentage points. The report goes out as "visibility dropped". Neither group changed: group A is 20.0% in both periods and group B is 60.0% in both. The fall exists only because period 2 contained fewer of the higher-rate group B answers.
Here is how the checklist resolves it.
| Step | Finding |
|---|---|
| Expected count per day | 10 answers |
| Gap days found | 3 days in period 2, each 5 answers short (group B) |
| Cause | Failed runs, still failed after the last retry |
| Even across groups? | No: all missing answers were group B |
| Observations per rate | 55 and 70 pooled; 35 and 20 for the groups (the 20 is under 30, so provisional) |
| Decision | C: restrict to the intact set, and report the groups separately |
With option C, Quillstone filters both periods to group A only (35 answers each: 20.0% and 20.0%, change 0.0 points) and reports group B as "4 of 7 days collected in period 2, 60.0% on 20 answers, provisional". The honest message is "no change in either group; the pooled figure moved because of missing group B runs". That is a smaller story than "visibility dropped", and the one the data supports.
How does 7-day smoothing change the picture?
Smoothing hides gaps in rates but not in counts. With a daily grain, the Explorer's 7-day average turns each point into that day pooled with the six before it: the sum of the seven days' numerators over the sum of their denominators, never an average of daily rates. A missing day therefore just leaves the pool, and the rest carries the weight (Explorer).
A smoothed rate can look continuous while resting on a thin sample. Look at the observation counts, not only the line, and note the provisional marks. And if a gap is uneven (the worked example above), smoothing does nothing to fix the mix.
For answer counts, smoothing is the mean per day, with days that had no answers counted as zero in the total, so a gap makes a smoothed count dip. Use raw daily counts when you are hunting for gaps, and the smoothed rate when you are reading a trend you have already checked.
What this method cannot tell you
- It cannot tell you what the missing answers would have said. Restricting to an intact set is a fair comparison of the answers you have; it is not an estimate of the answers you lack.
- A clean collection record is not proof of a real change. Engines can answer differently from day to day for many reasons. Checking for gaps removes one explanation, not all of them (see why your AI visibility score changed for the wider diagnosis).
- Gaps are not always visible as gaps. A day with the full count of answers can still contain answers that were not analysed yet, because mention extraction runs after collection. Brand metrics use analysed answers only, so recent days can be temporarily thin in brand metrics while the collected count looks normal.
- The tool cannot decide for you. The 80% engine rule guards the product's built-in comparisons, and the 30-observation mark only labels thin rates. Your own windows need a written rule of your own.
Common mistakes
- Reading a missing day as a zero and explaining a "collapse".
- Comparing "this week" against "last week" while one period is still in progress. Ending the window at yesterday, as the Explorer requires, avoids the incomplete current day.
- Pooling every engine when one engine joined or left mid-period.
- Quoting a smoothed line without the observation counts.
- Fixing the gap in the report and forgetting to record it, so the next reader repeats the mistake.
Frequently asked questions
Do missing days count as zero visibility?
No. Answer metrics are built from completed executions only, so a failed run is absent from both sides of the division. A metric whose denominator is empty shows no value, not 0%. What changes is the sample size, and rates under 30 observations are marked provisional.
How many missing days are too many?
There is no universal number. The product's own comparisons treat an engine as measured in a period when it ran on at least 80% of the period's answered days, which is 6 of 7 in a full week. That is a reasonable starting point for your own rule, provided you also check that the missing answers are not concentrated in one prompt group.
Should I wait for a backfill before reporting?
Wait for the same-day retries (03:00, 05:00, 09:00 and 17:00 UTC), then treat a still-failed run as final for that day. The docs describe retries for the same day only, so do not plan a report around later recovery.
Is a day with no Google AI Overview a missing day?
No. The request succeeded and Google showed no AI answer, which feeds the shown rate. It is left out of answer metrics like visibility, and it is a real observation. A request that fails at DataForSEO or Google is a different thing: a failed run. See zero mentions, no answer or failed collection.
Does a gap in one engine affect the others?
Not the other engines' answers. It can change a pooled number, though, because the Explorer pools engines unless you break down or filter by engine. Break down by engine and the gap stays in its own row.
How do I know the share of my intended monitoring that actually ran?
Count what ran against what you planned: active prompt targets times days, per engine. The companion post on monitoring completeness covers that measure in more detail.
Next step
Open the Explorer, set Answers collected to a daily grain and break it down by engine for your last 28 days. Fill in the checklist for any day that looks short, and pick a decision before you send the next report. For the tools behind this, see the Explorer guide, Metrics defined, and the analytics feature overview.
- explorer
- collection health
- data gaps
- trend analysis


